OPTIONS LOGIC.ai User Guide
Welcome to OptionsLogic.AI PRISM — an AI-powered options analytics platform for active traders. This guide walks you through every feature with step-by-step instructions and screenshots so you can get the most out of the platform.
Logging In
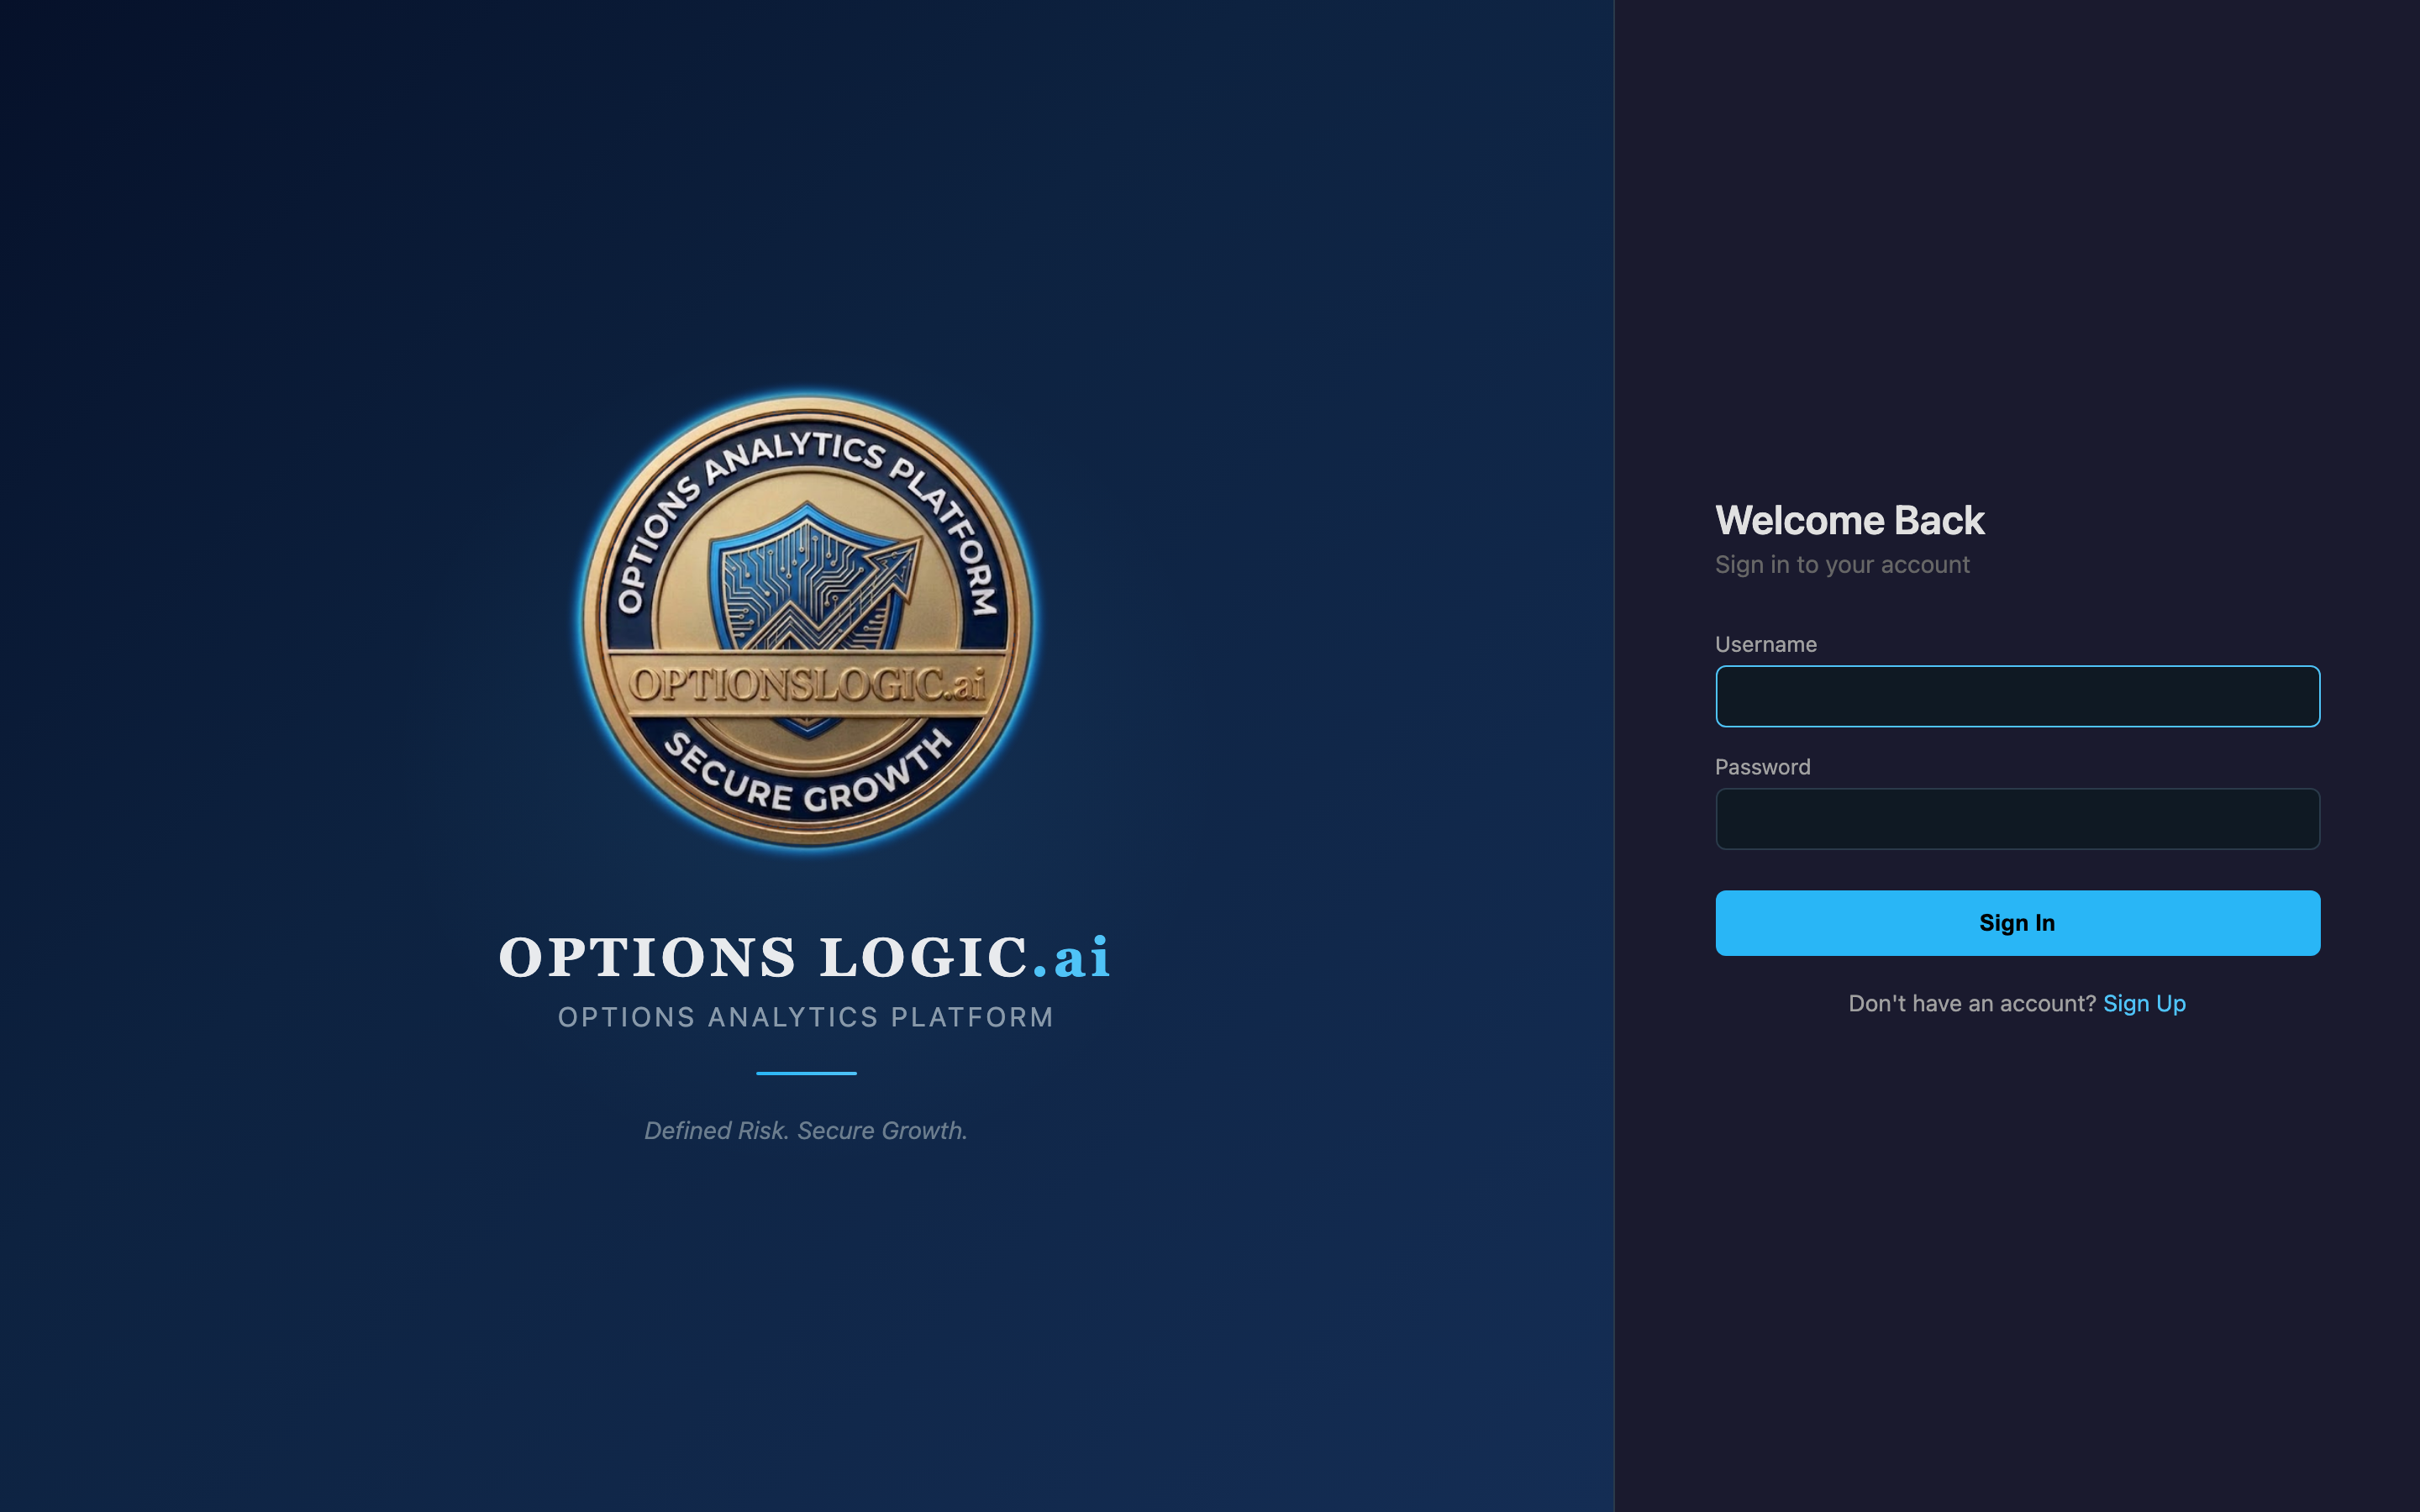
Navigate to optionslogic.ai in your browser. You'll see the split-panel login page with the OptionsLogic.AI PRISM badge on the left.
- Enter your Username in the first field.
- Enter your Password in the second field.
- Click Sign In. You'll be redirected to the Dashboard.
Dashboard
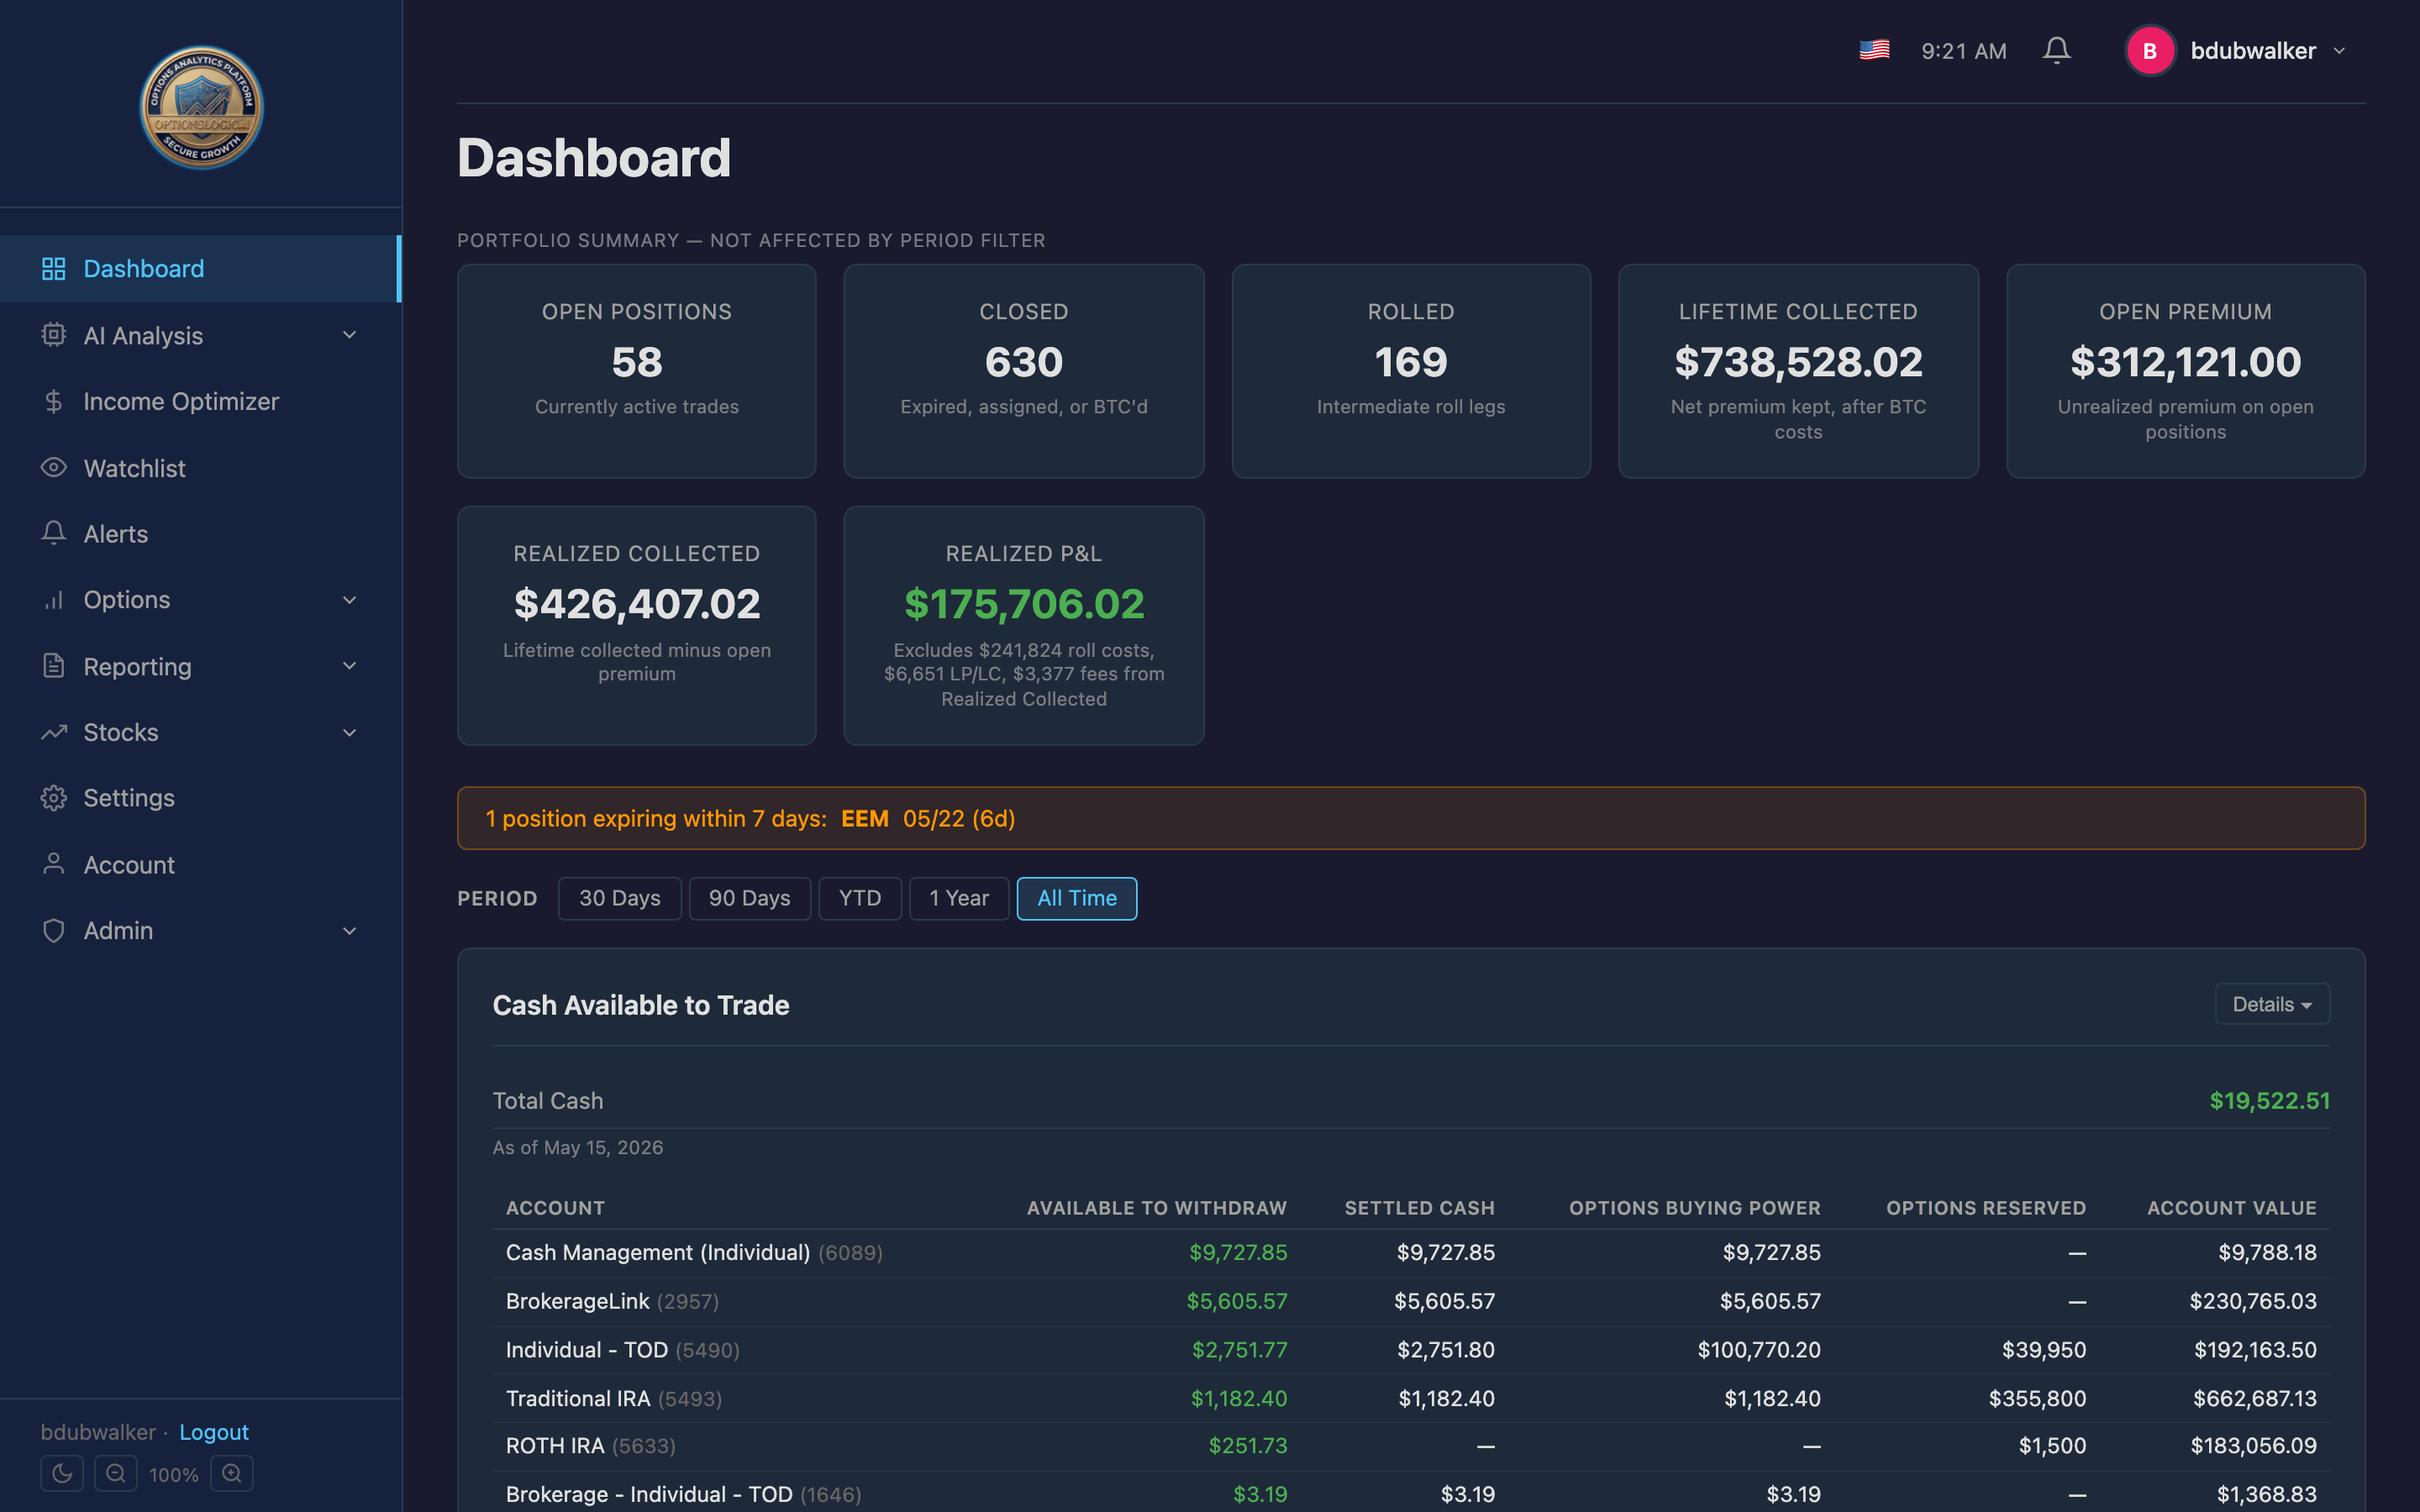
The Dashboard is your portfolio command center. It loads automatically after login and gives you a complete overview of your trading activity.
Summary Cards
At the top, five cards show your key metrics at a glance:
- Open Positions — number of currently active trades
- Closed — total trades closed (expired, assigned, or bought to close)
- Rolled — intermediate roll legs
- Lifetime Collected — total premium received across all trades
- Open Premium — unrealized premium on open positions
Below those, Realized Collected and Realized P&L show your actual income after subtracting close costs and rolls.
Period Filters
Use the period filter bar (30 Days, 90 Days, YTD, 1 Year, All Time) to scope every chart and metric on the page to a specific time window.
Cash Available to Trade
A per-account breakdown showing available funds, settled cash, options buying power, and total account value. This data comes from your Fidelity account snapshots.
Win Rate, Capital Deployed, and Strategy Mix
Three gauges showing your win rate percentage, capital deployment percentage, and a donut chart breaking down positions by strategy type (CC, CCP, CS, PS, etc.).
P&L Charts
Two chart sections show Weekly P&L and Monthly P&L as bar charts with a cumulative line overlay, so you can see both individual period performance and your overall trajectory.
P&L by Account and Expiration Timeline
P&L by Account shows a horizontal bar chart of realized profit per account. Expiration Timeline groups your open positions by days to expiration (0-7, 7-14, 14-30, 30+) so you can see what's coming up.
Cash Secured Capital and Win/Loss
Shows total capital held by open positions and your win/loss record with average win and average loss amounts.
Recovery Portfolio
At the bottom of the Dashboard, the Recovery Portfolio section shows what your portfolio would be worth if all underwater stock positions recovered to their cost basis. It includes per-account breakdowns, expandable losing position detail, and a weekly snapshot history.
Navigation
The left sidebar provides access to every feature. Sections with arrows (AI Analysis, Options, Reporting, Stocks) expand to reveal sub-pages when clicked.
- Dashboard — portfolio overview (home page)
- AI Analysis — Signal Confluence, Fibonacci, TD Sequential, Backtester, AI Performance, AI Tickers, Roll Analysis
- Income Optimizer — premium income tracking
- Watchlist — ticker monitoring
- Alerts — price and condition notifications
- Options — Positions, Best Scenario, Leg Analysis, Trade Actions, and all strategy pages
- Reporting — 7 report types
- Stocks — Available for CCs, Stock Positions
- Settings — credentials, downloads, preferences
- Account — profile management
Signal Confluence
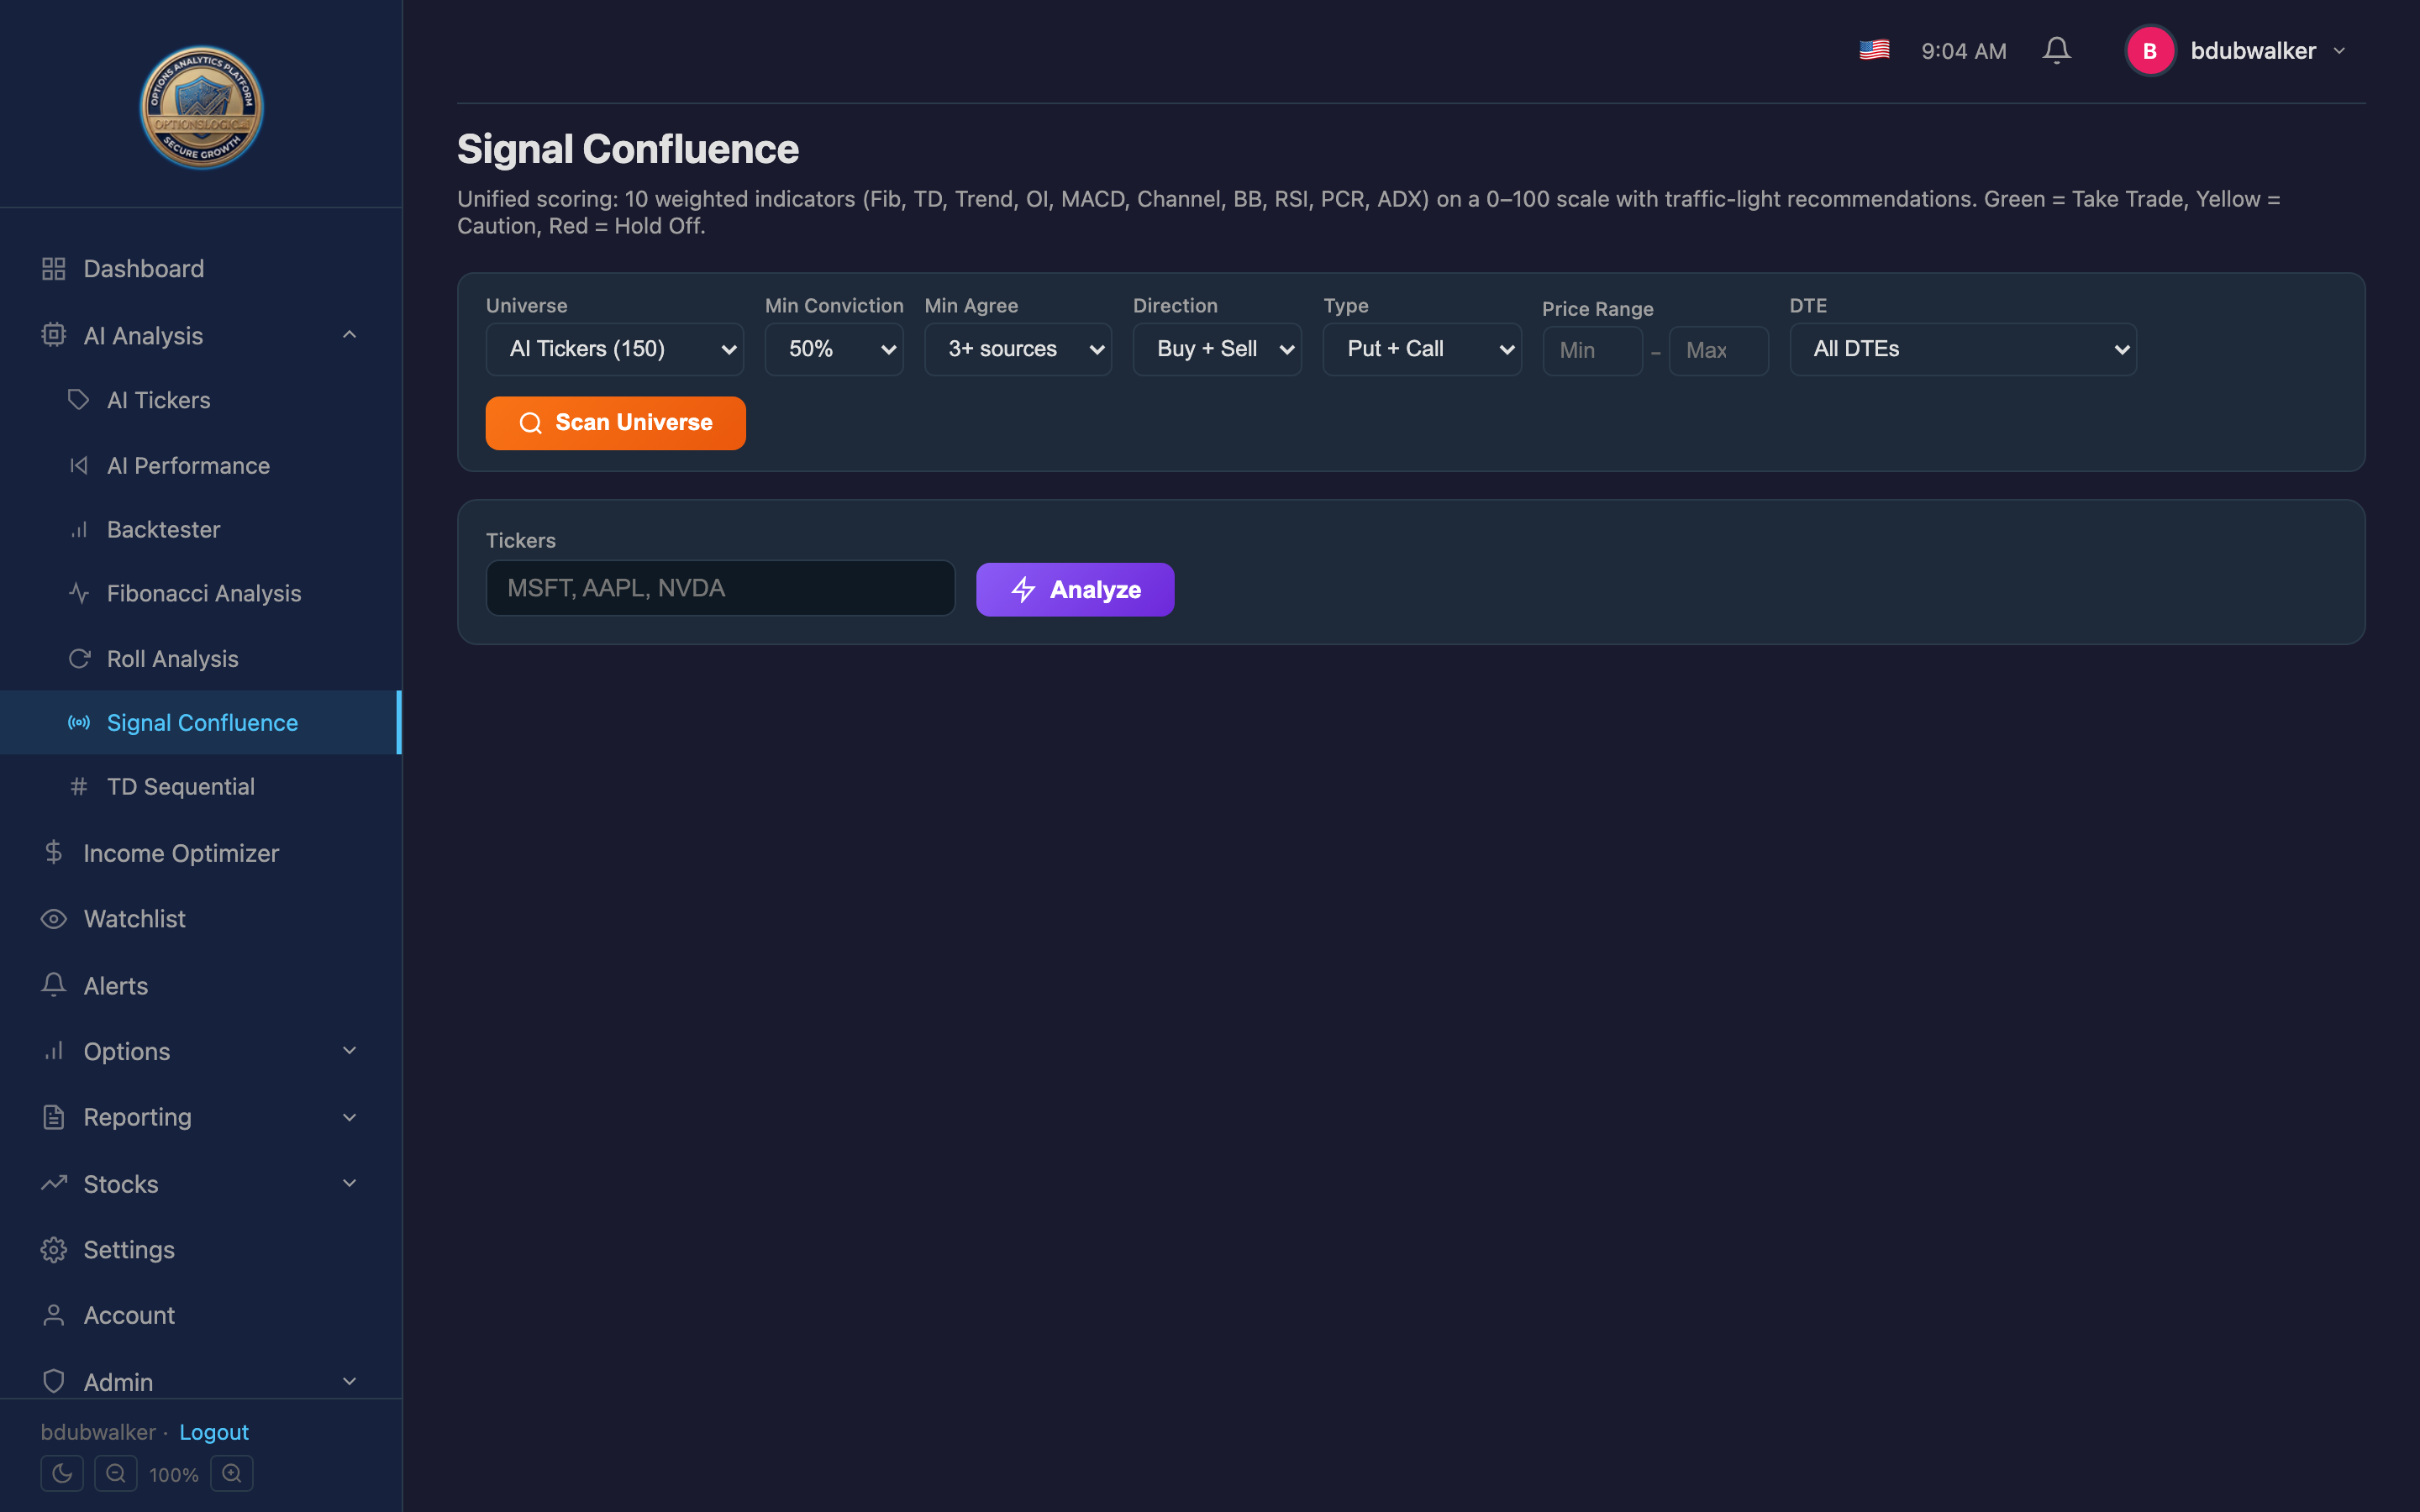
Signal Confluence is the platform's core AI analysis tool. It scores trade opportunities across 10 weighted technical indicators and delivers a single conviction score on a 0-100 scale.
How to Run a Scan
- Select your Universe — AI Tickers, Nasdaq 100, S&P 500, or enter custom tickers.
- Set Min Conviction (default 50%) and Min Agree (minimum indicators that must agree).
- Choose Direction (Buy, Sell, or both), Type (Put, Call, or both), Price Range, and DTE range.
- Click Scan Universe to analyze every ticker in the selected universe.
Reading the Results
Each result card shows the ticker, direction, strategy type, conviction score, and a color-coded recommendation:
- Green — Strong setup, take the trade
- Yellow — Caution, wait for confirmation
- Red — Signals disagree, hold off
Click any result to see the full indicator breakdown — every indicator's individual score and contribution is visible.
Quick Analysis
For a quick check on specific tickers, enter them in the Tickers field below the scan controls and click Analyze.
Fibonacci Analysis
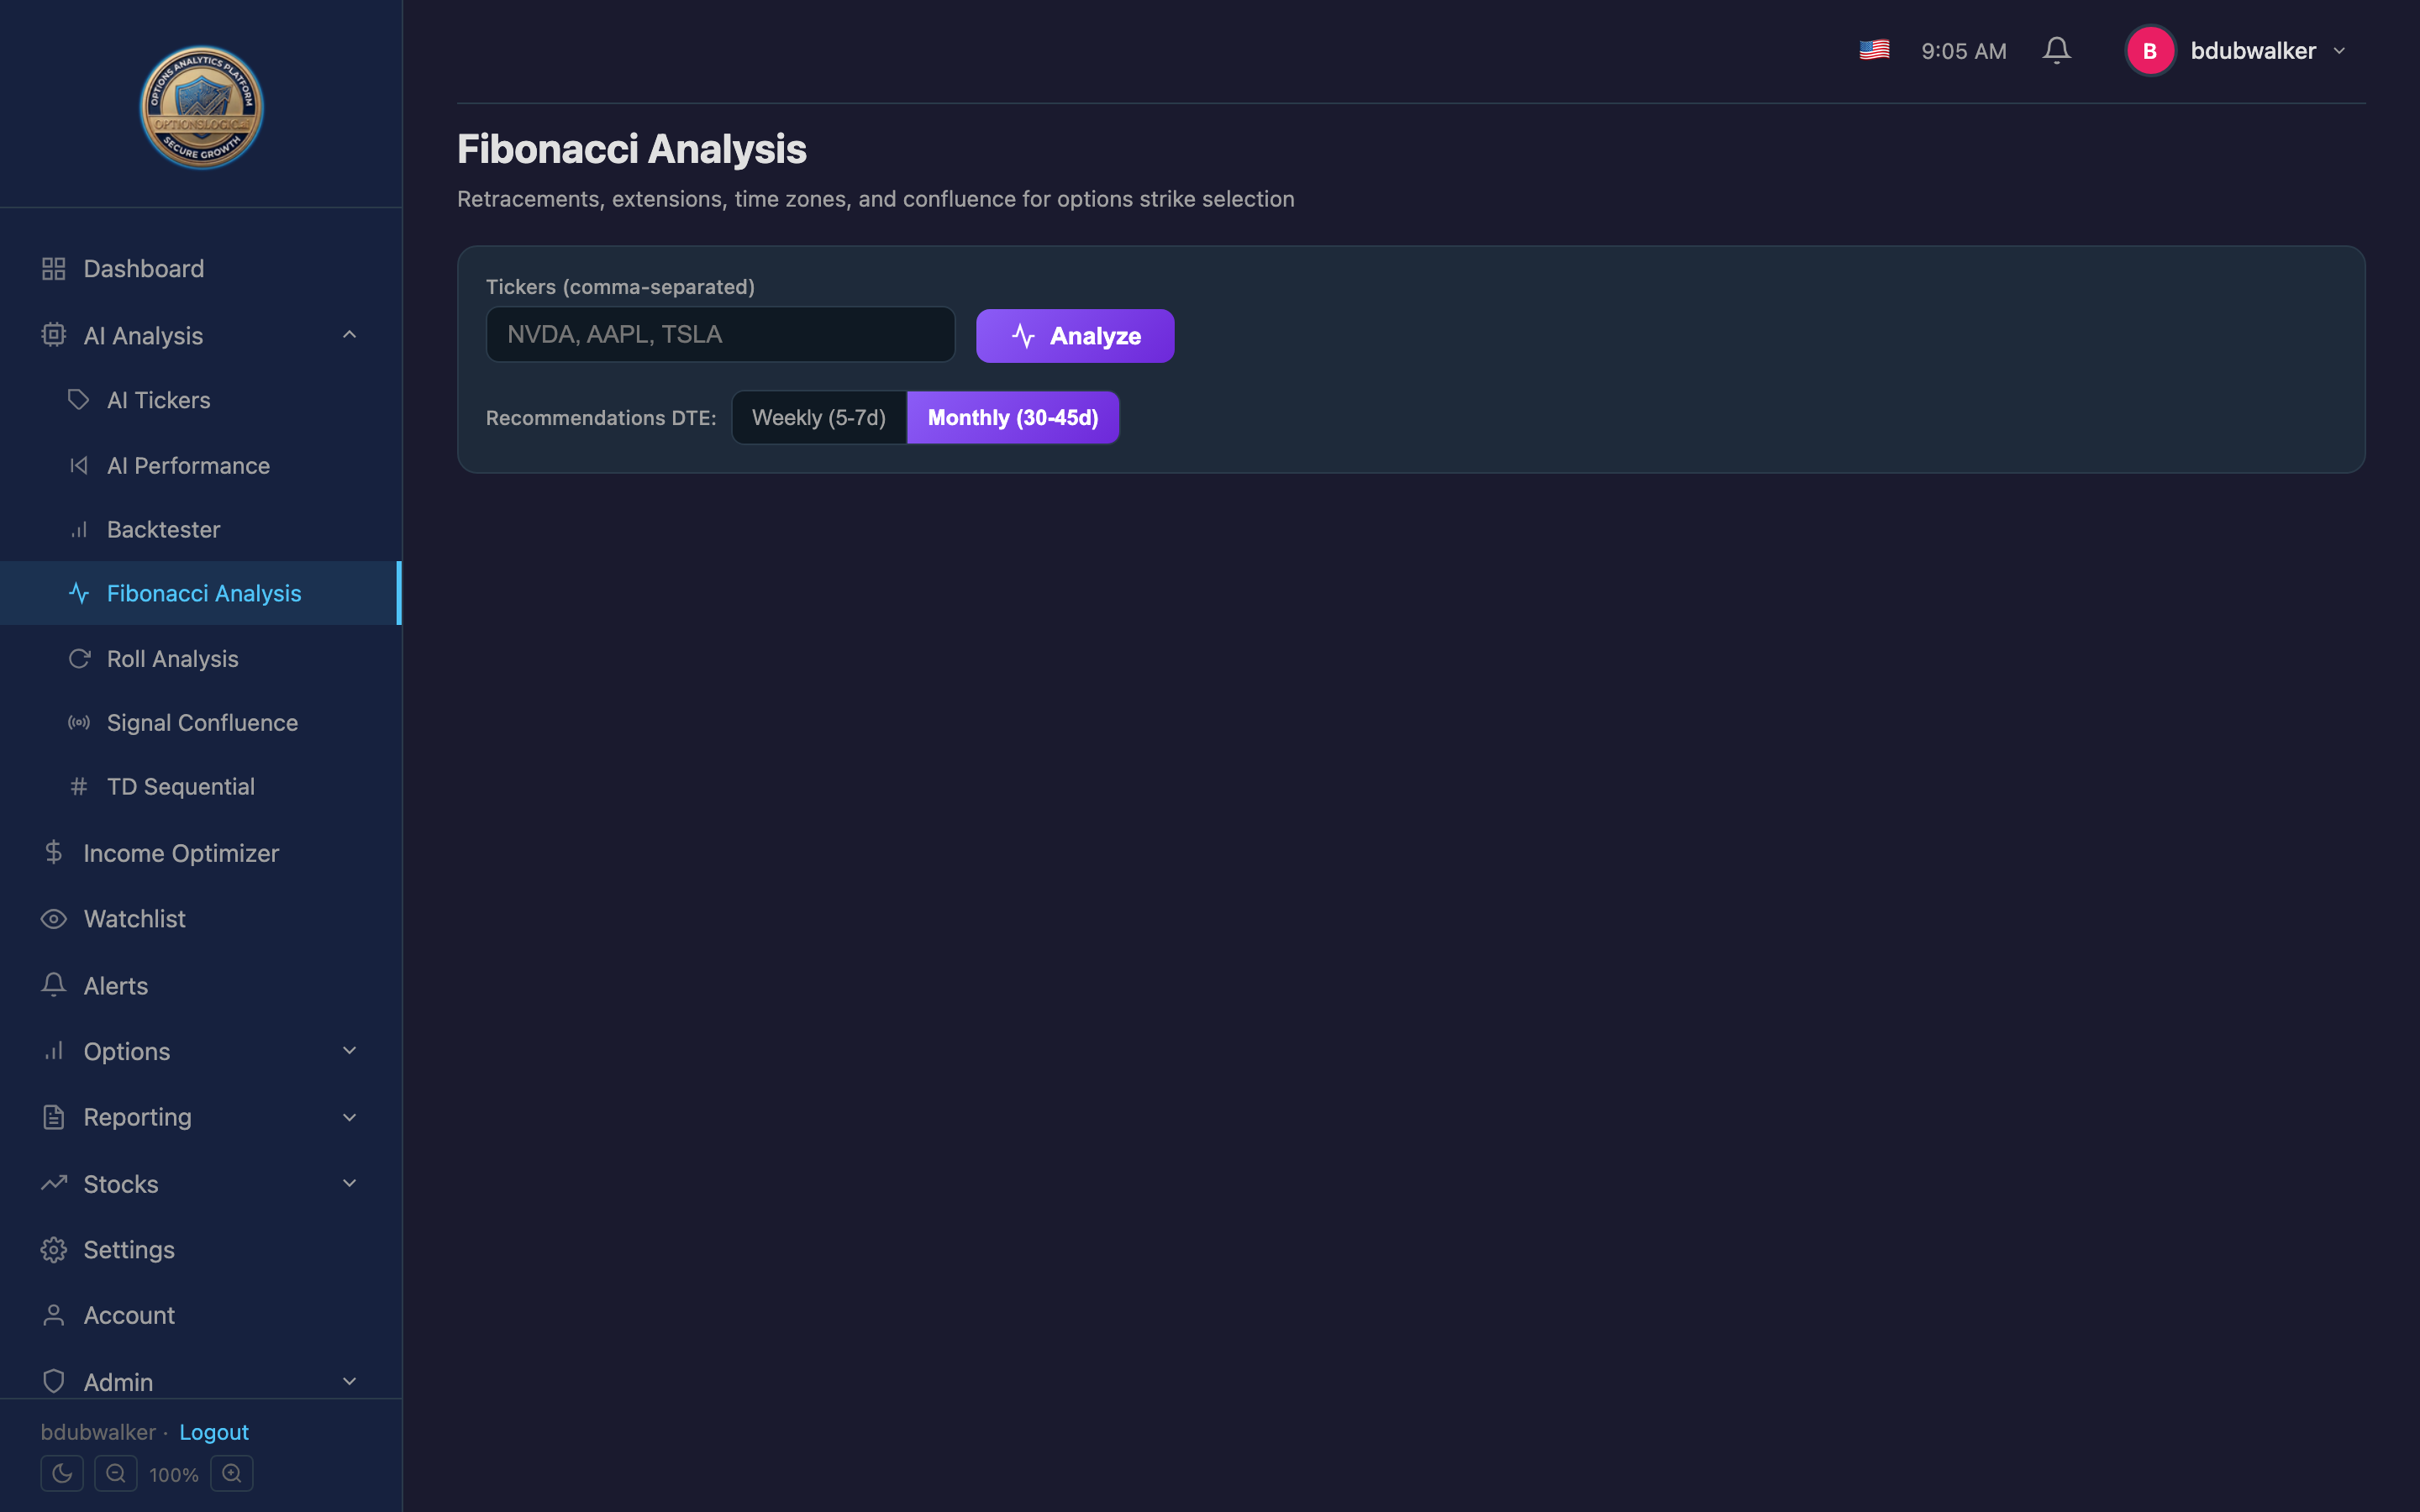
The Fibonacci Analysis tool calculates retracement and extension levels for any ticker, helping you identify optimal strike prices based on key support and resistance zones.
- Enter a ticker symbol.
- Select a timeframe (daily, weekly, etc.).
- The tool calculates Fibonacci retracement levels (23.6%, 38.2%, 50%, 61.8%, 78.6%) and extension levels from recent swing highs and lows.
- Use the highlighted confluence zones (where multiple Fib levels cluster) to identify the strongest support/resistance areas for strike selection.
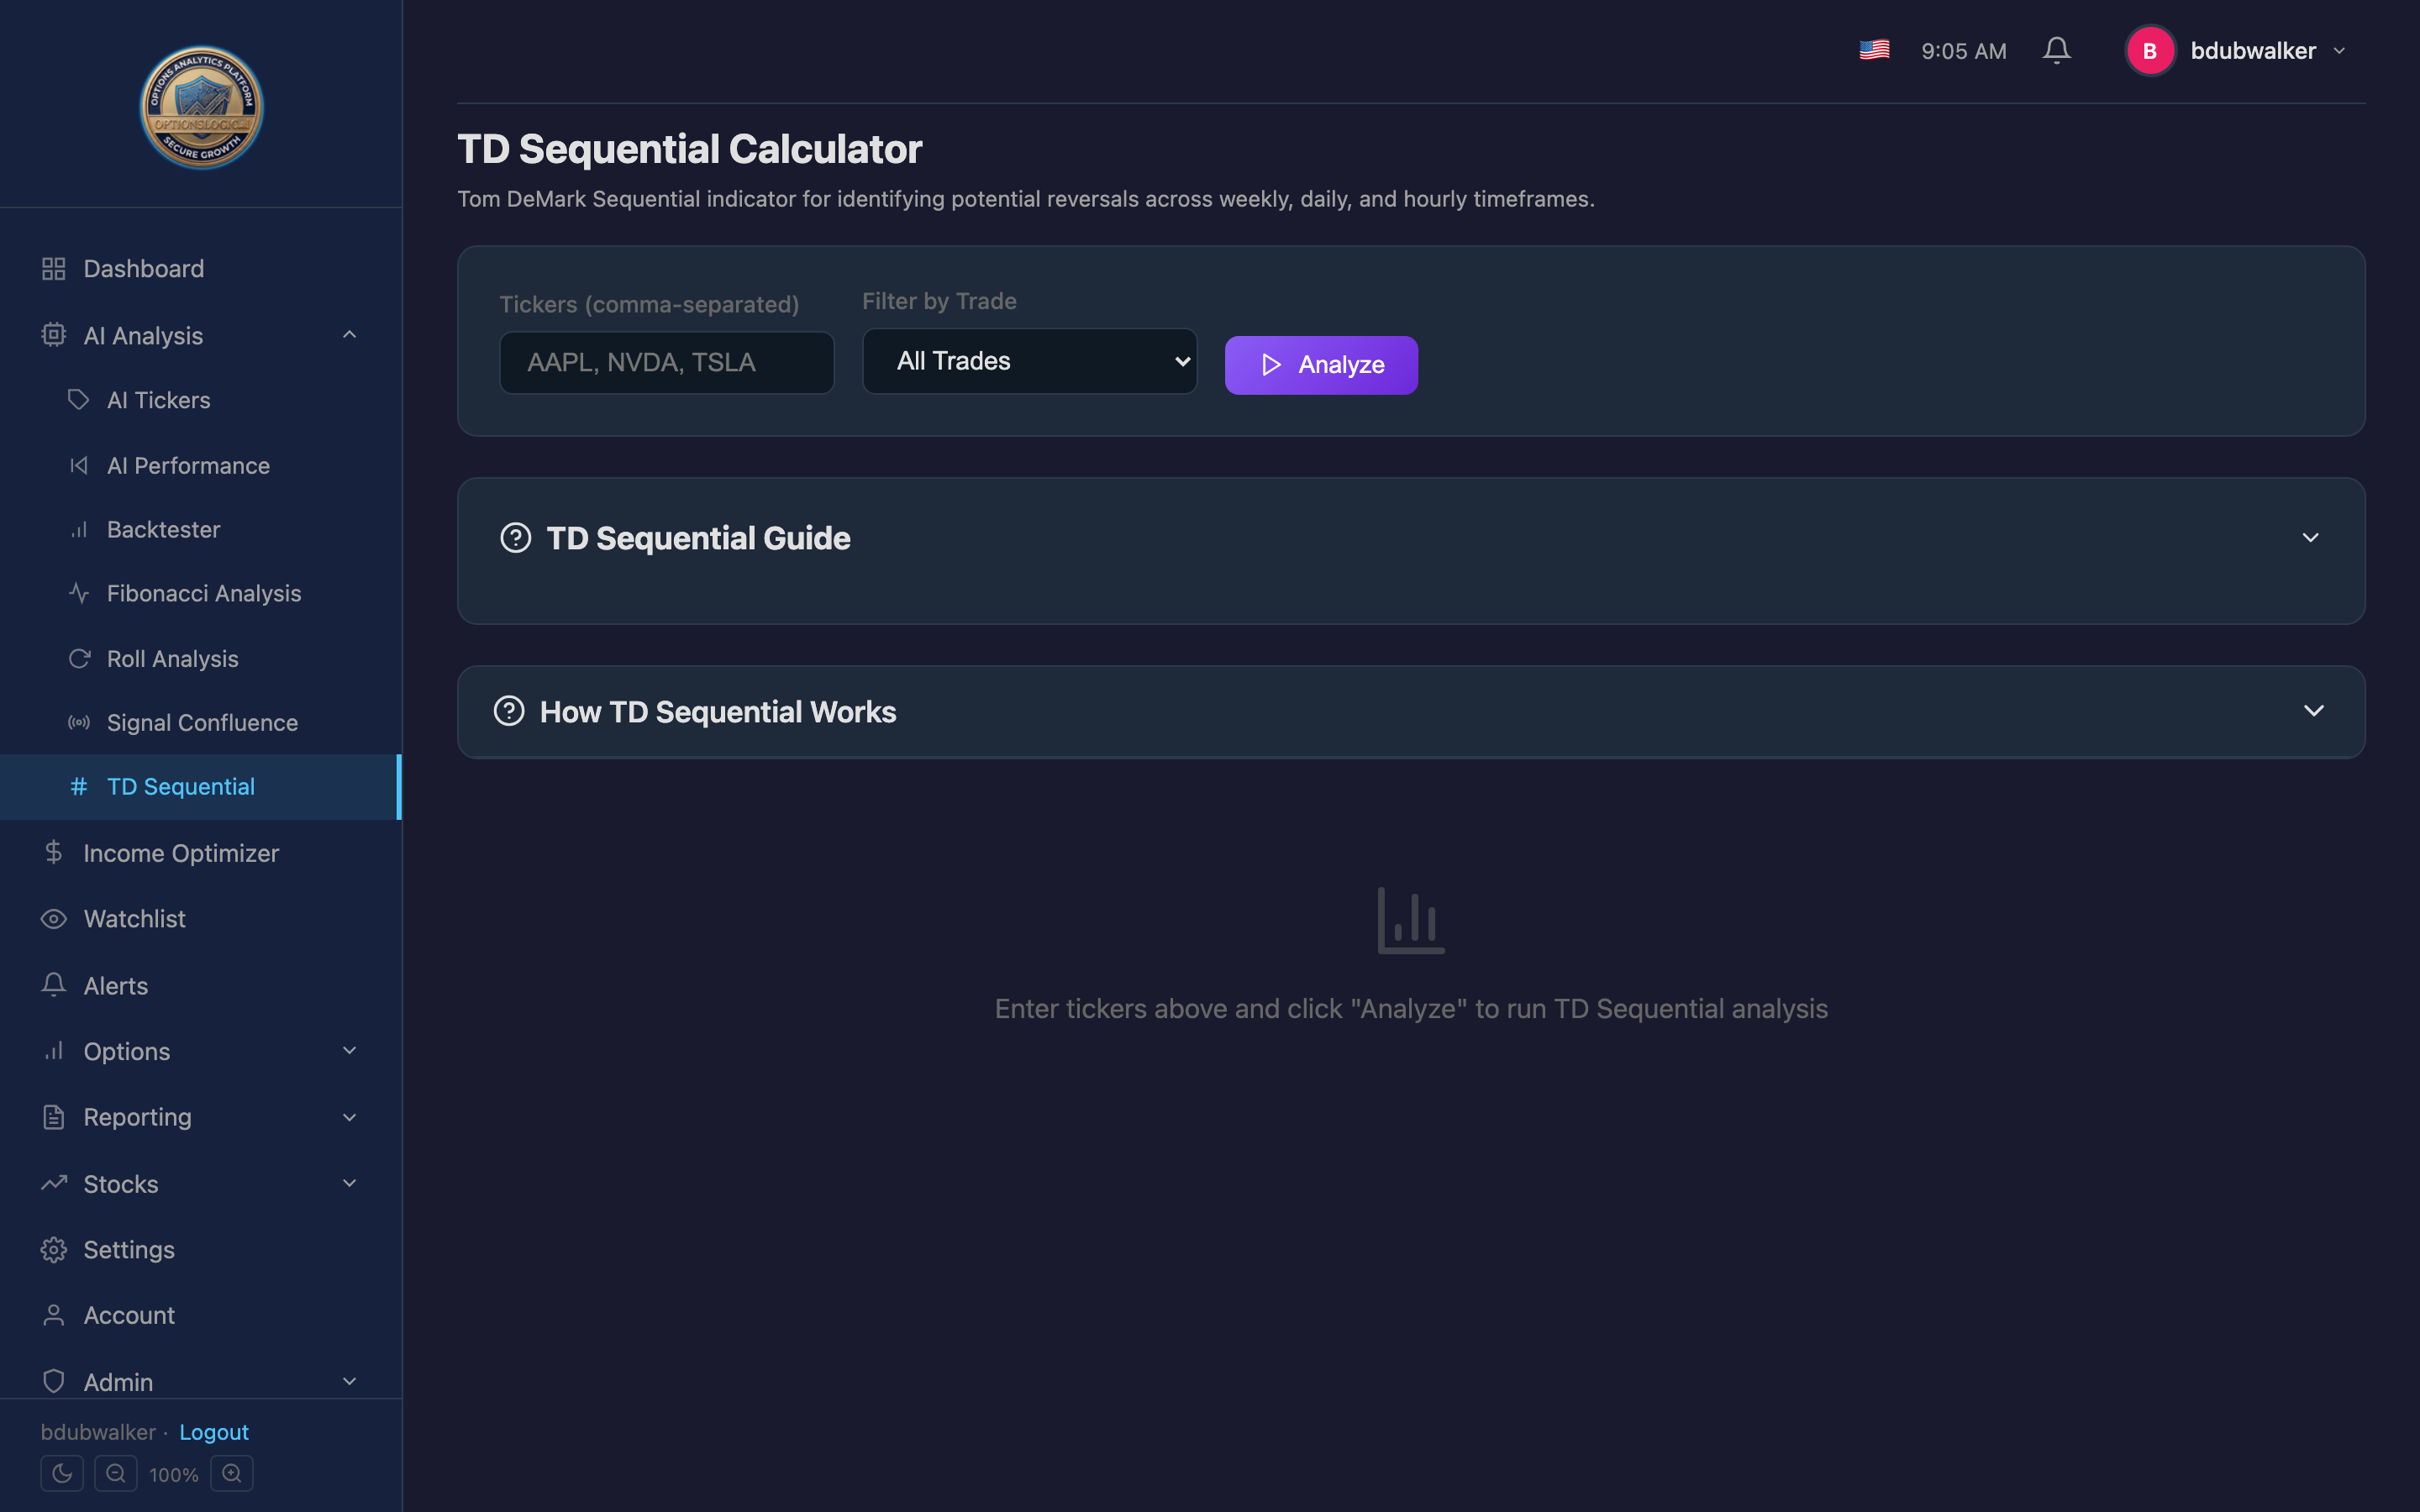
TD Sequential
TD Sequential is a trend-following indicator that identifies potential exhaustion points in price trends. It helps you time entries and exits by counting consecutive candles in a directional move.
- Enter a ticker symbol.
- Select a timeframe.
- The chart displays TD Setup counts (1-9) and TD Countdown sequences.
- A completed 9-count signals potential trend exhaustion — a possible reversal or pullback zone.
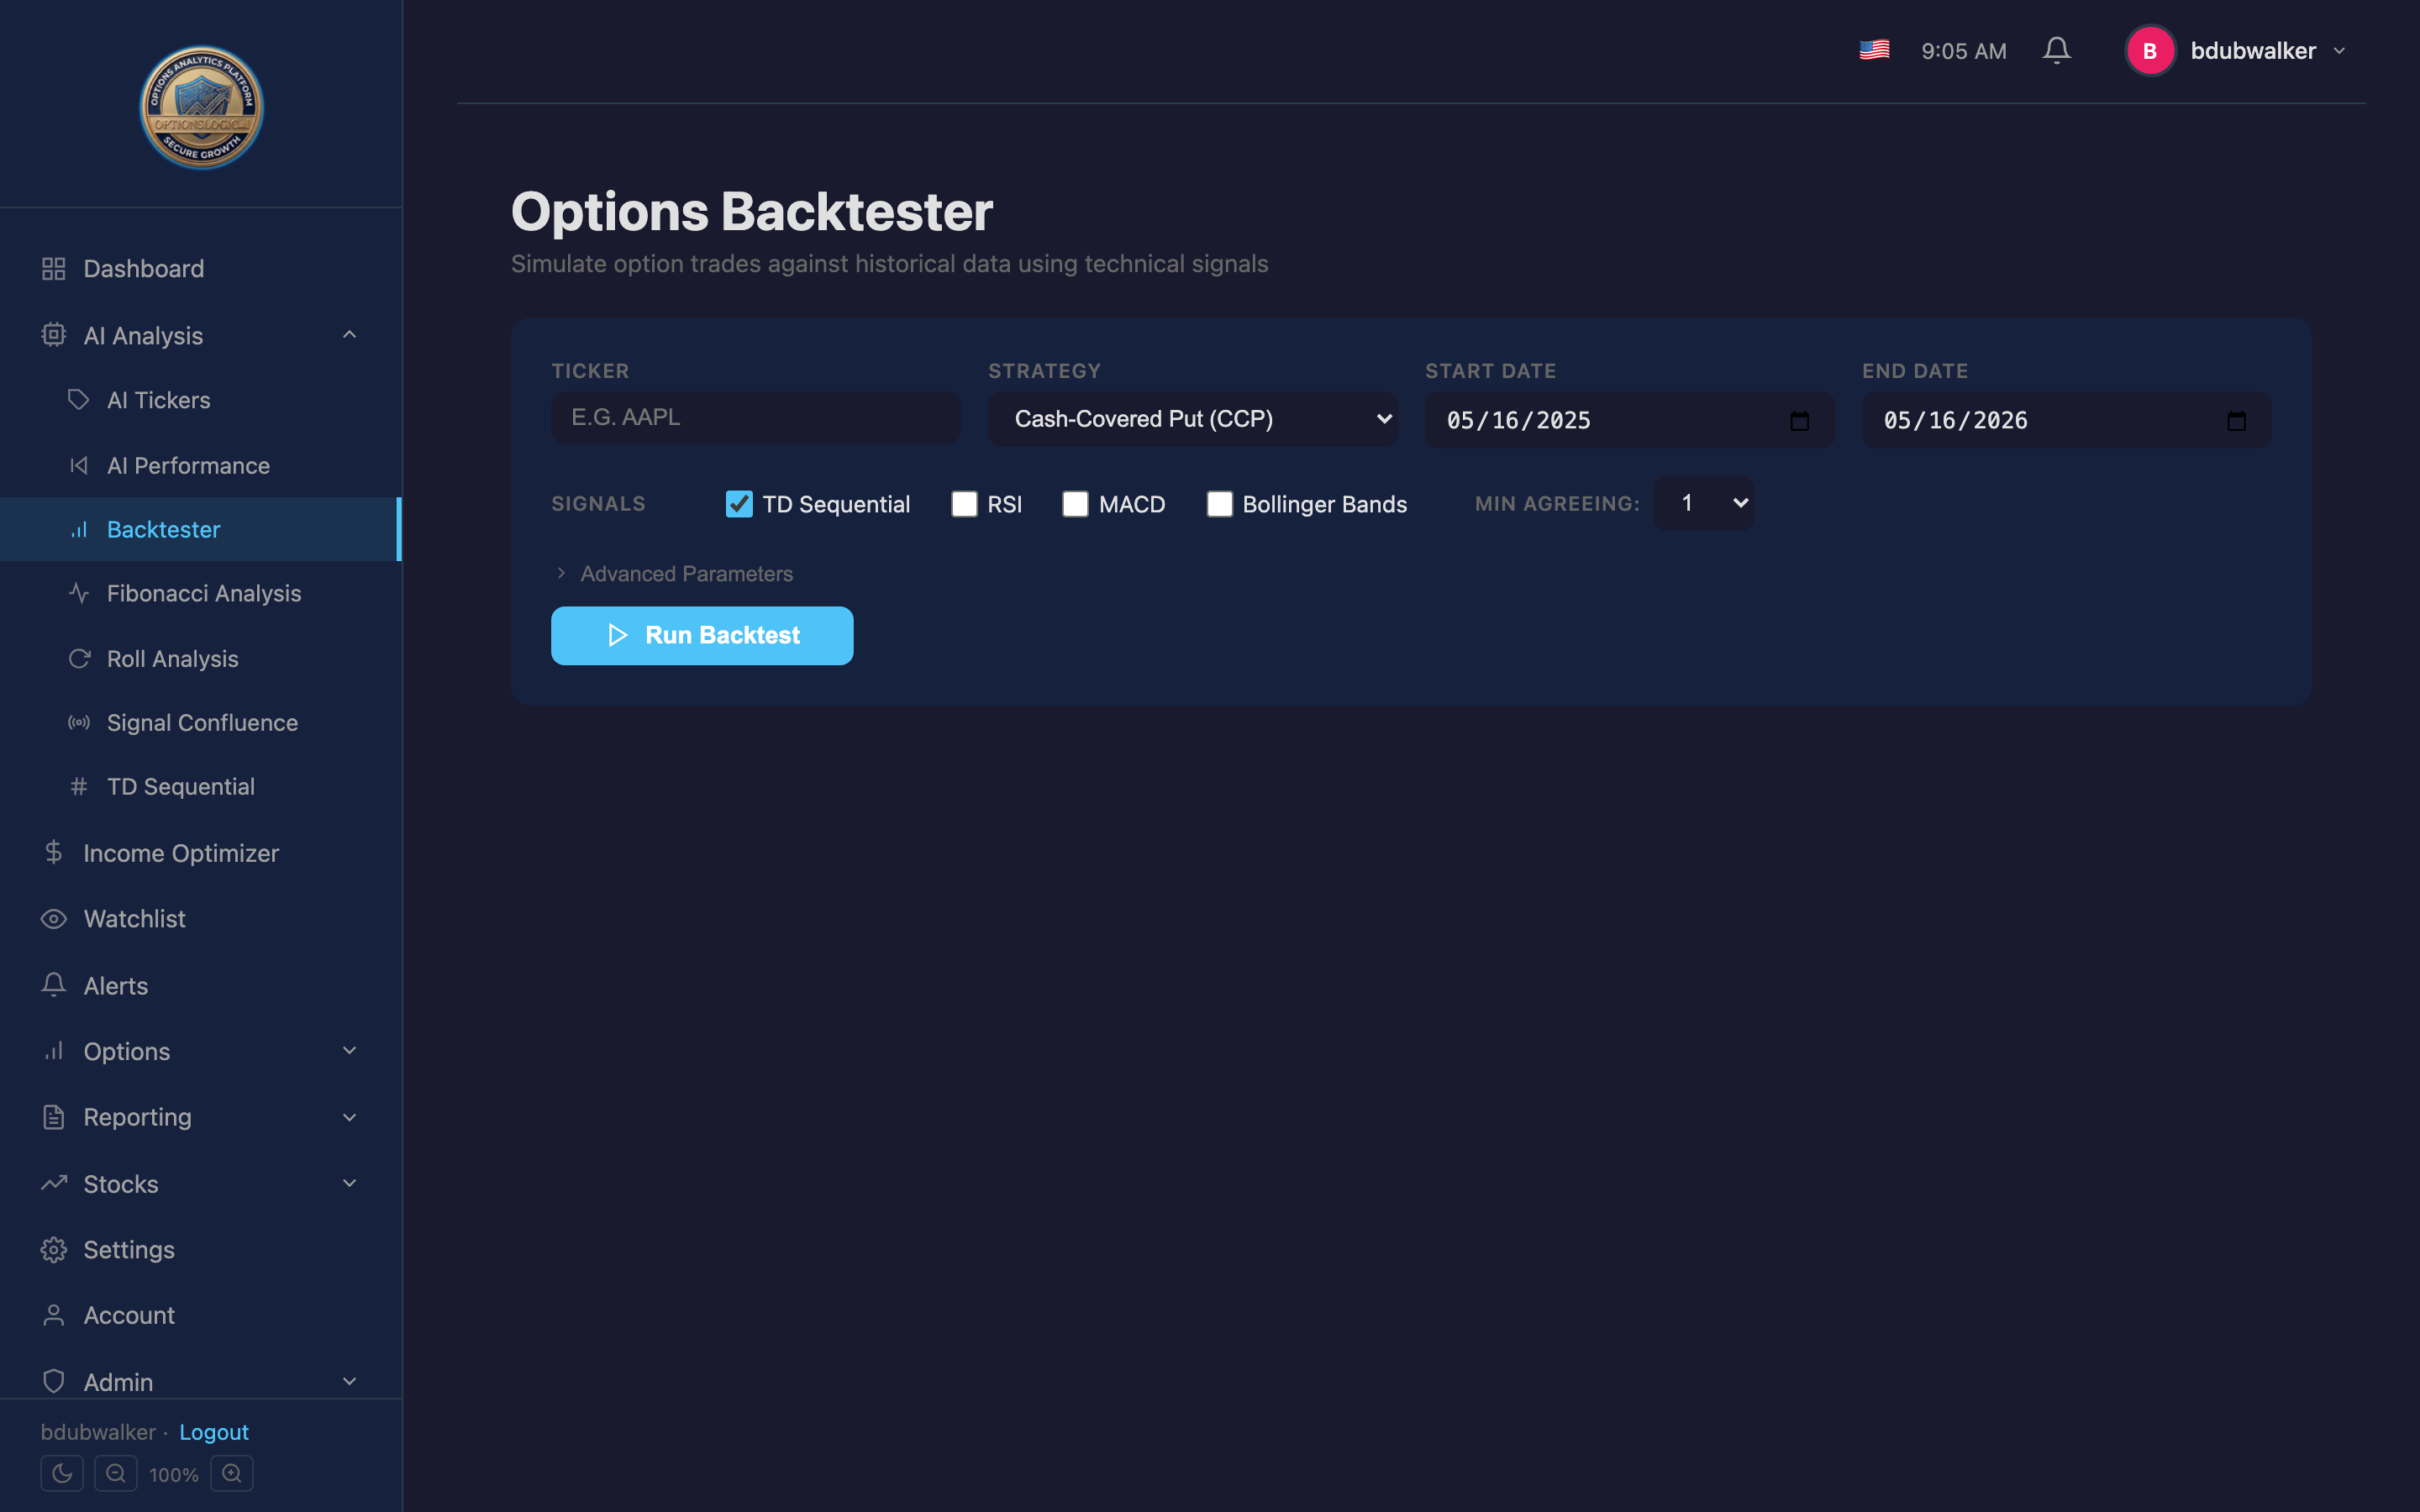
Backtester
The Backtester lets you simulate options strategies against historical data before committing real capital. Test whether a strategy would have been profitable under past market conditions.
- Enter a ticker and select a strategy (CC, CCP, LC, LP, CS, PS, IC).
- Set a date range (up to 2 years of history).
- Choose which signal sources trigger entries — TD Sequential, RSI, MACD, Bollinger Bands.
- Adjust advanced parameters: DTE target, delta target, profit target, stop-loss, spread width, and starting capital.
- Click Run Backtest to see the equity curve, trade log, and summary statistics.
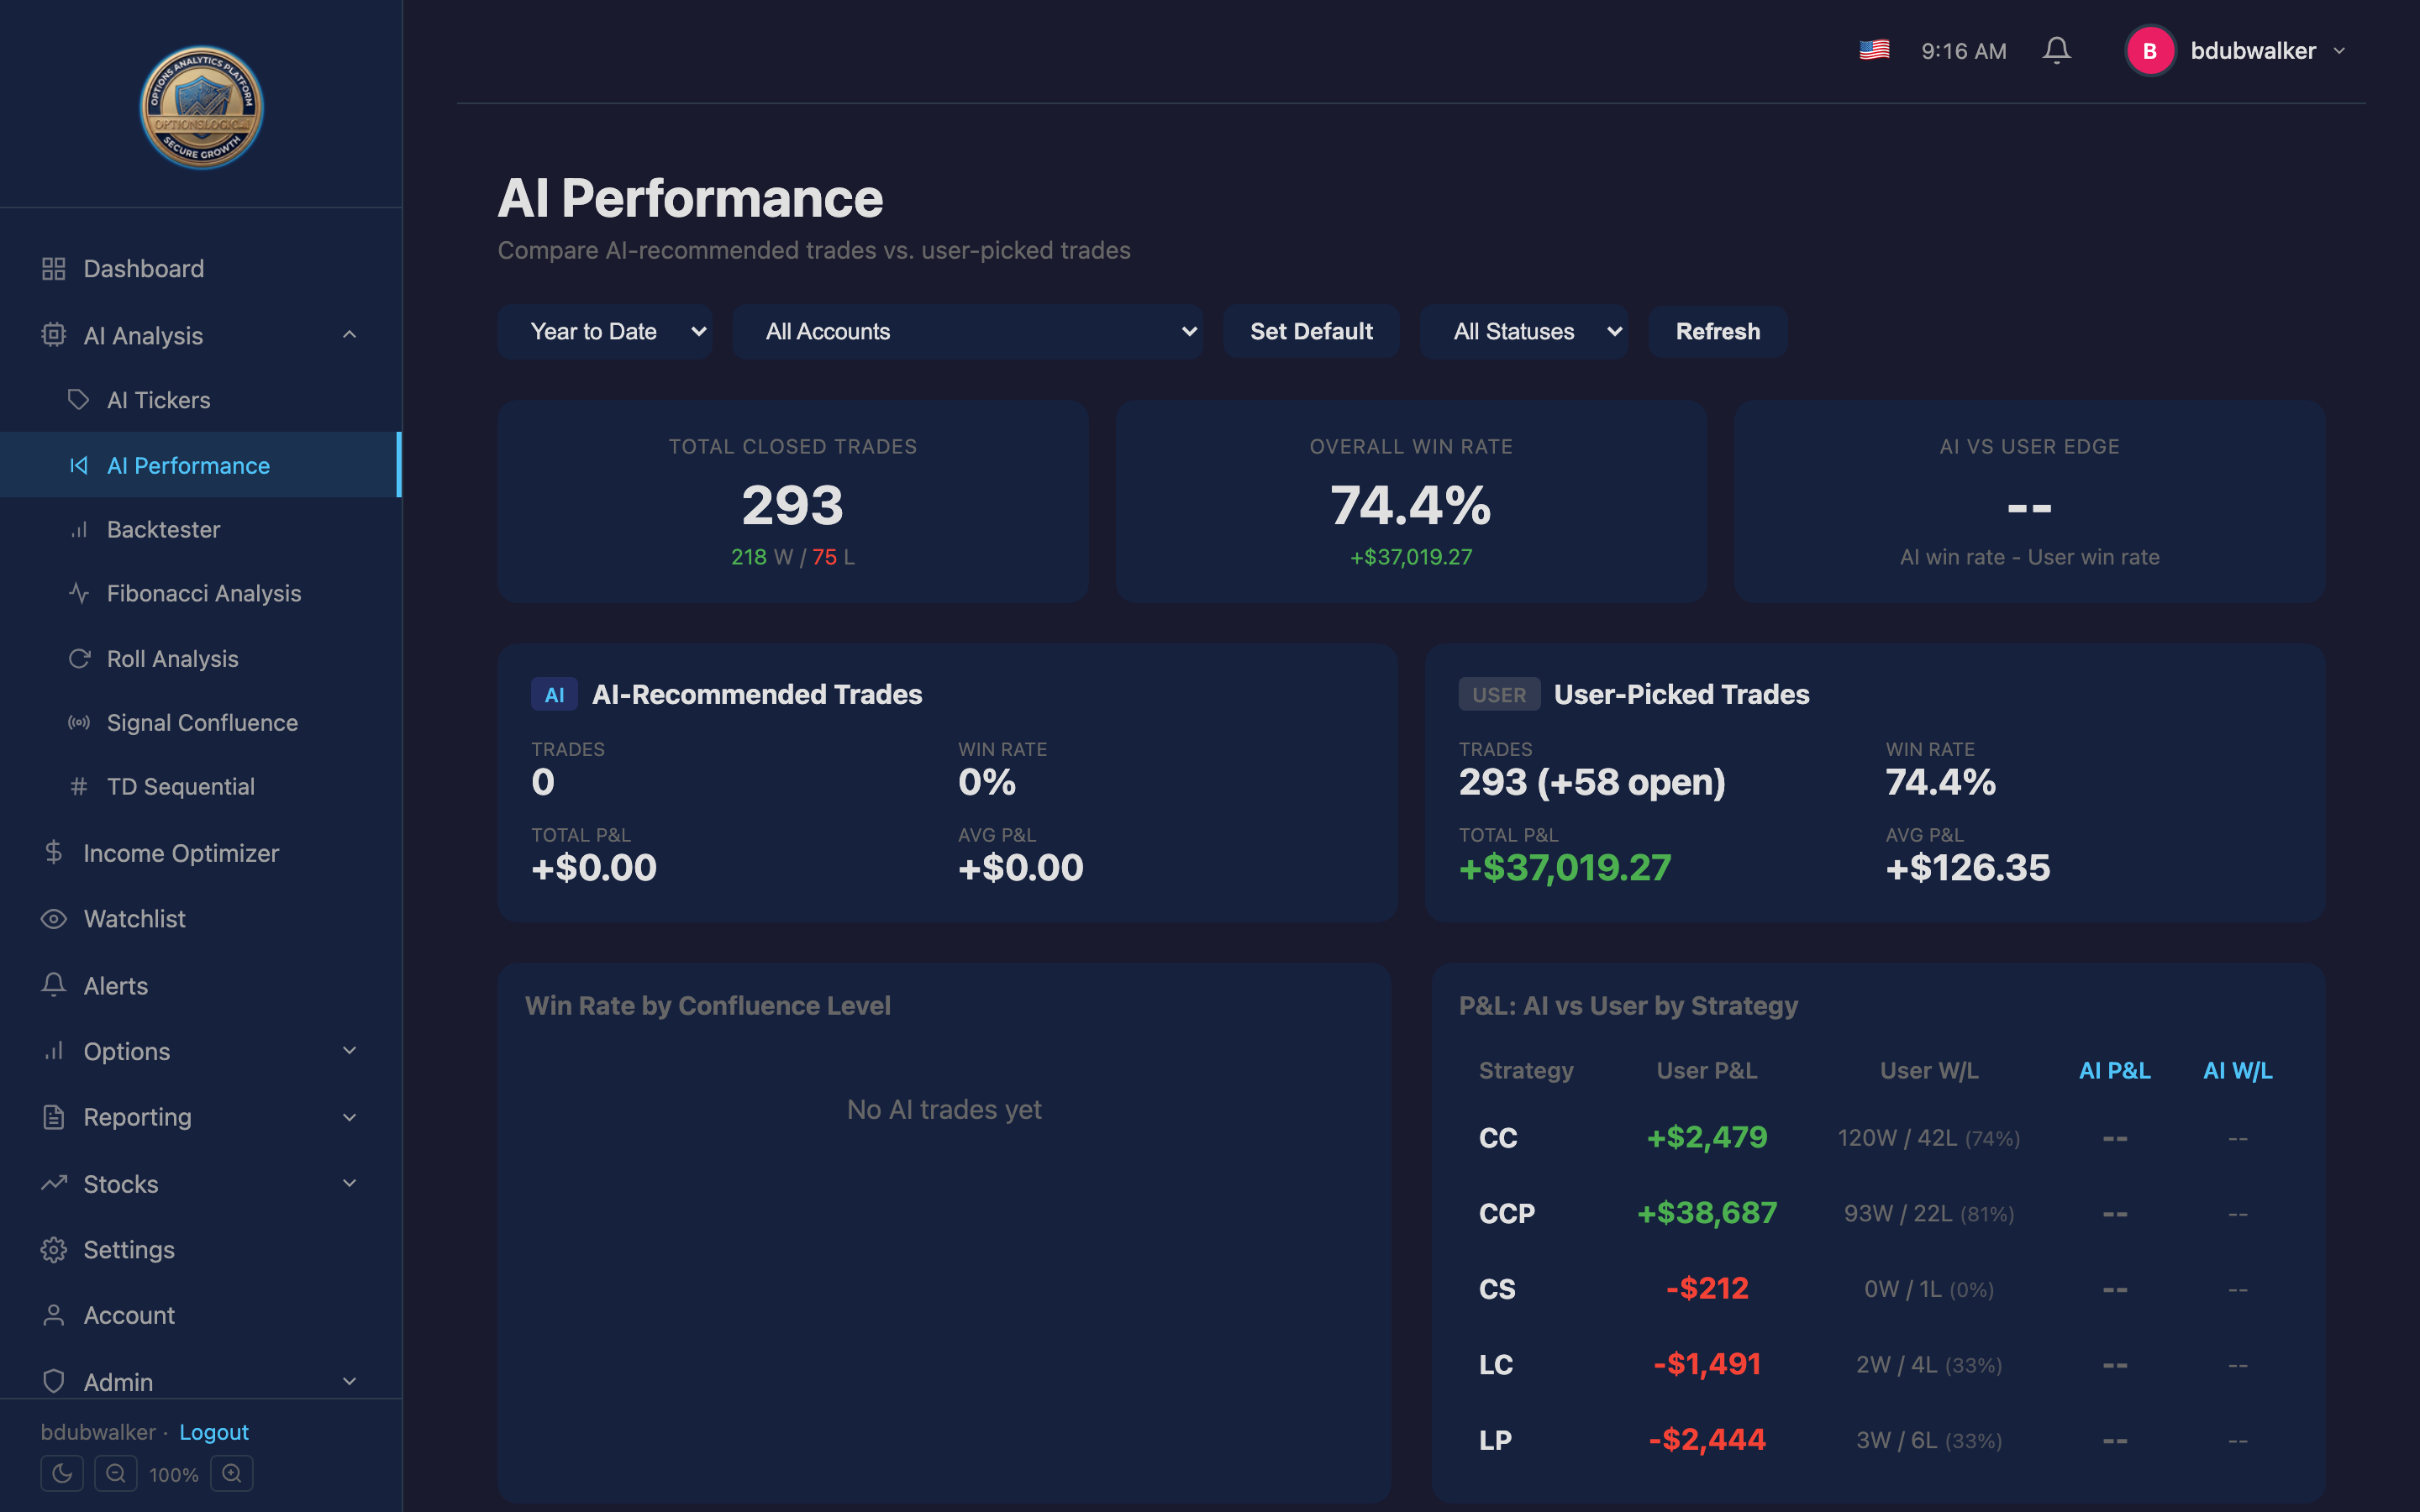
AI Performance
AI Performance tracks how AI-recommended trades perform compared to your own picks. It answers the question: "Is the AI actually giving me an edge?"
What You See
- Summary cards — total closed trades, overall win rate, AI vs User edge
- AI vs User comparison — side-by-side win rate, total P&L, average P&L
- Confluence breakdown — performance by signal strength (HIGH / MEDIUM / LOW)
- Strategy breakdown — P&L and win rate per strategy type, split by AI vs User
- Individual trade log — sortable, filterable table with AI tagging
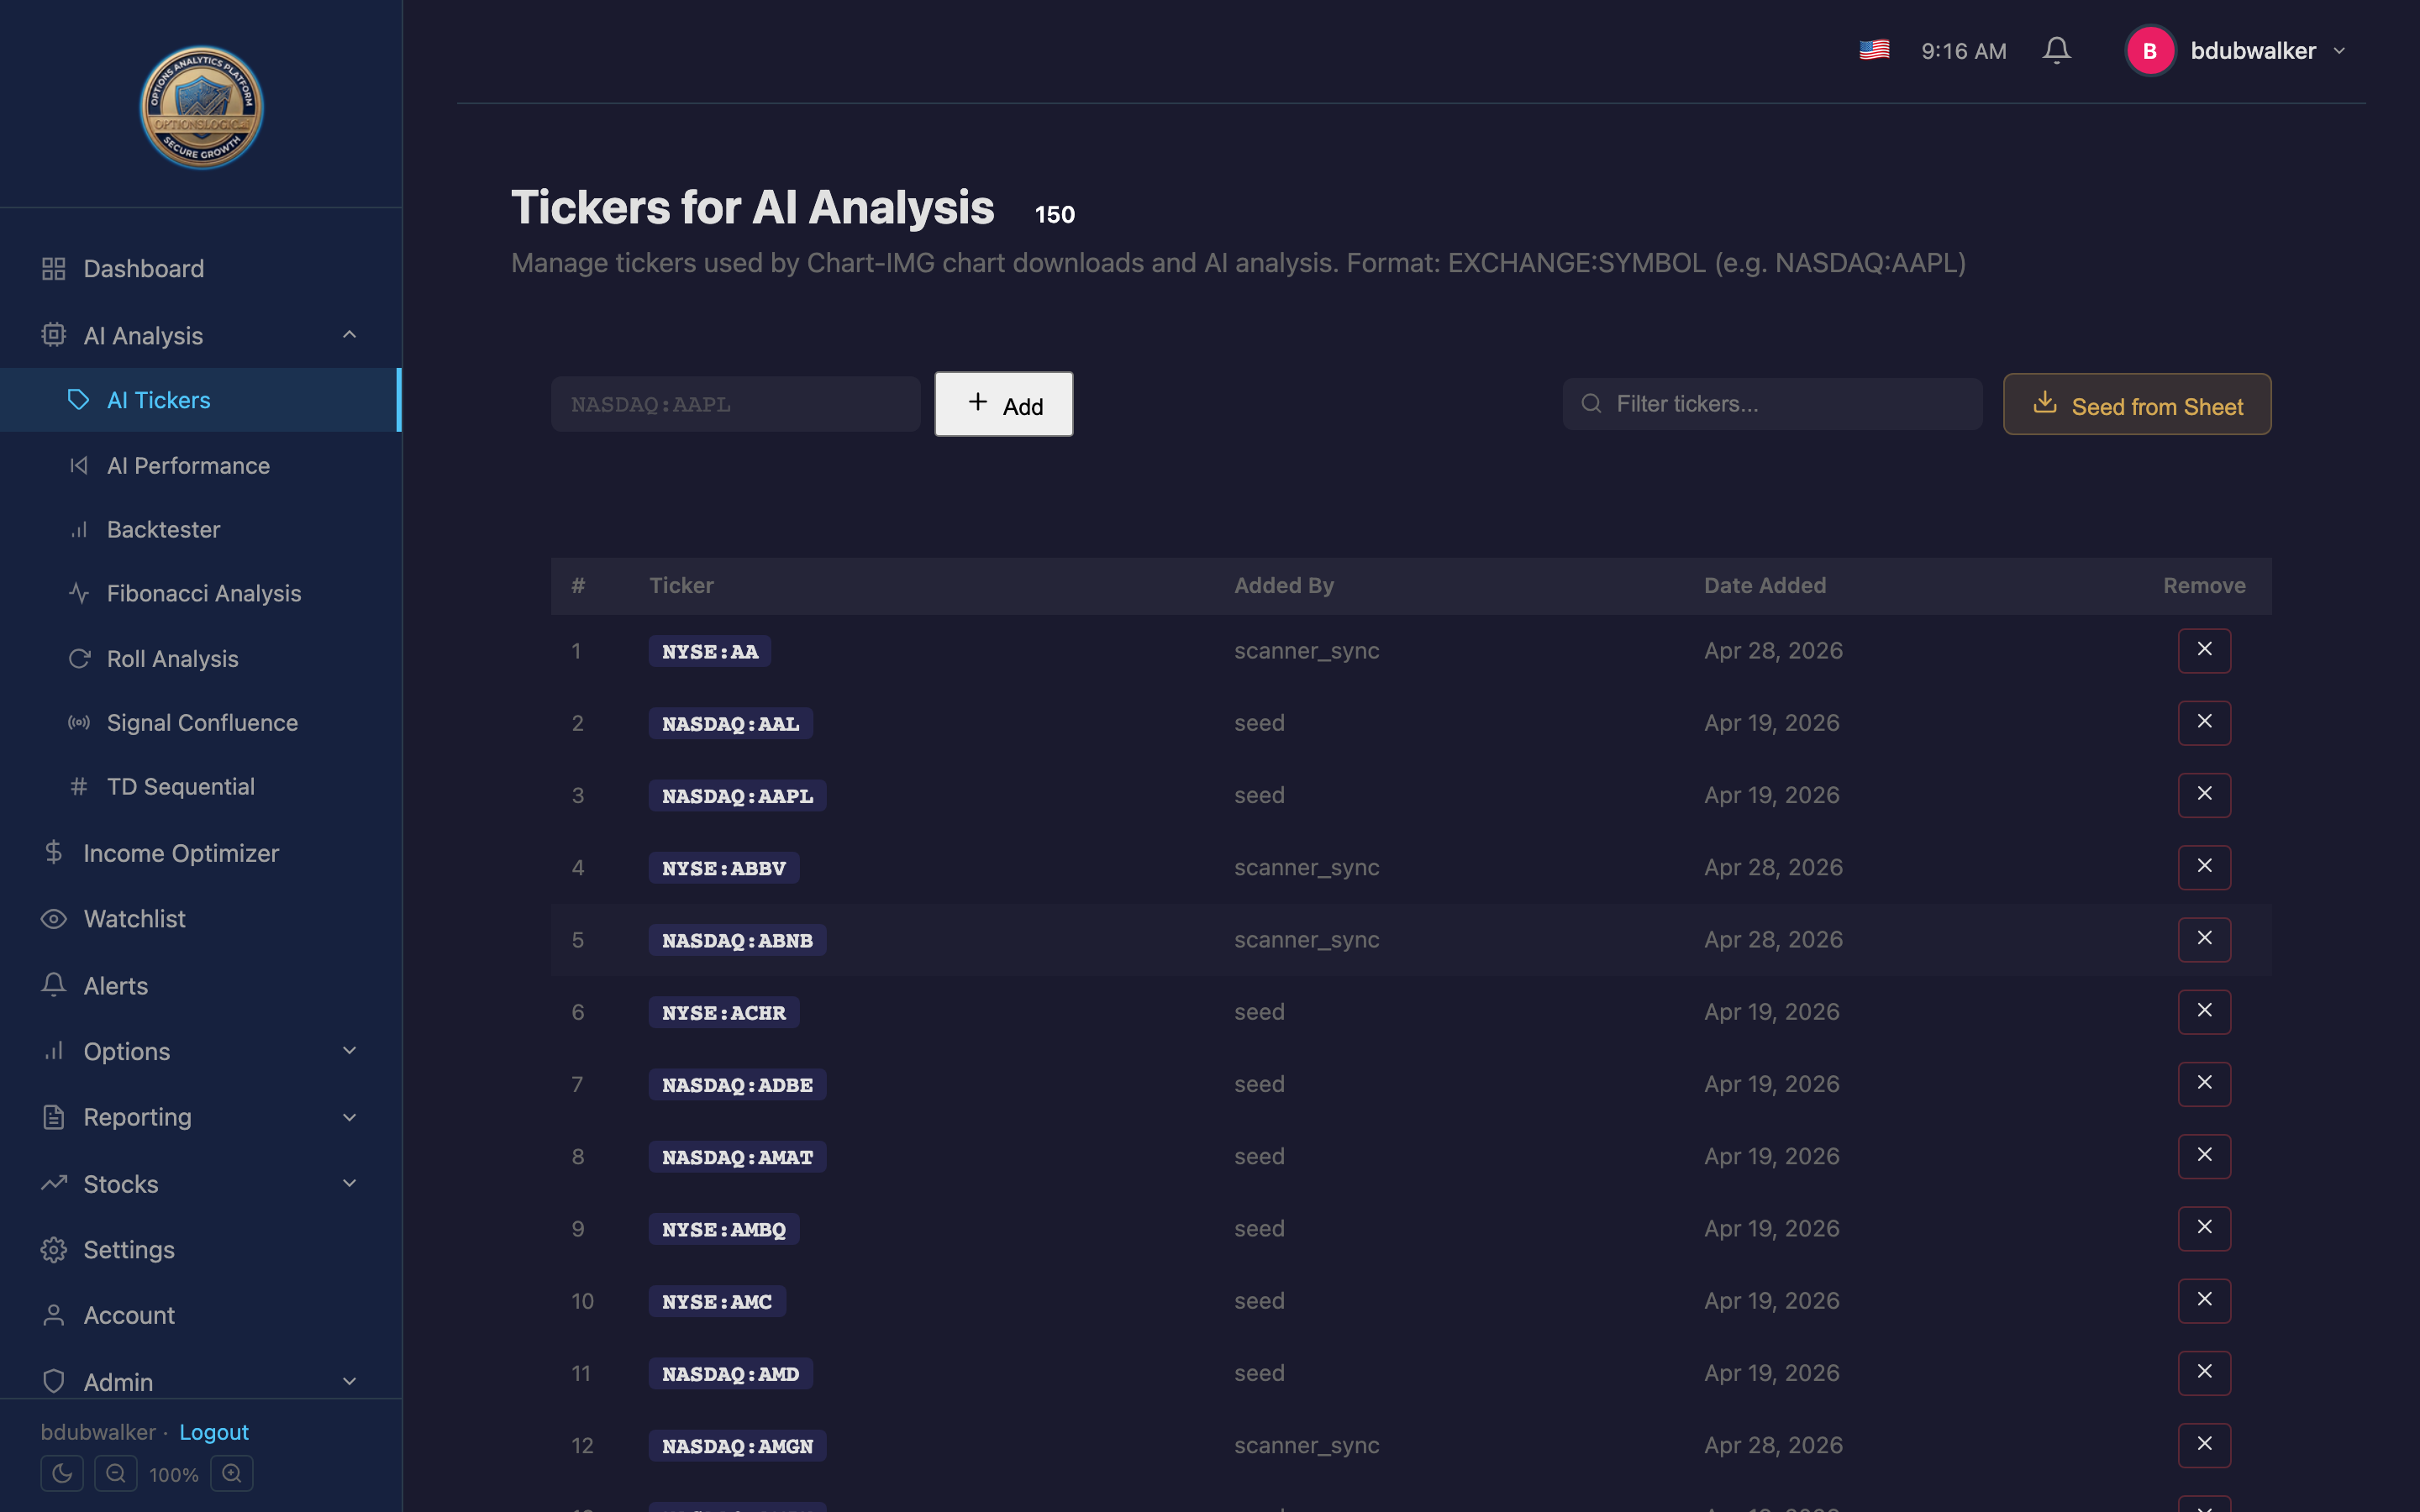
AI Tickers
AI Tickers manages the curated list of symbols that the AI analysis tools scan. Only tickers in this list are analyzed by Signal Confluence, Fibonacci, and TD Sequential scans.
- Use the Add Ticker field to add a new symbol (exchange prefix is auto-detected).
- Click the remove button next to any ticker to stop analyzing it.
- Use the search/filter bar to find tickers in the list.
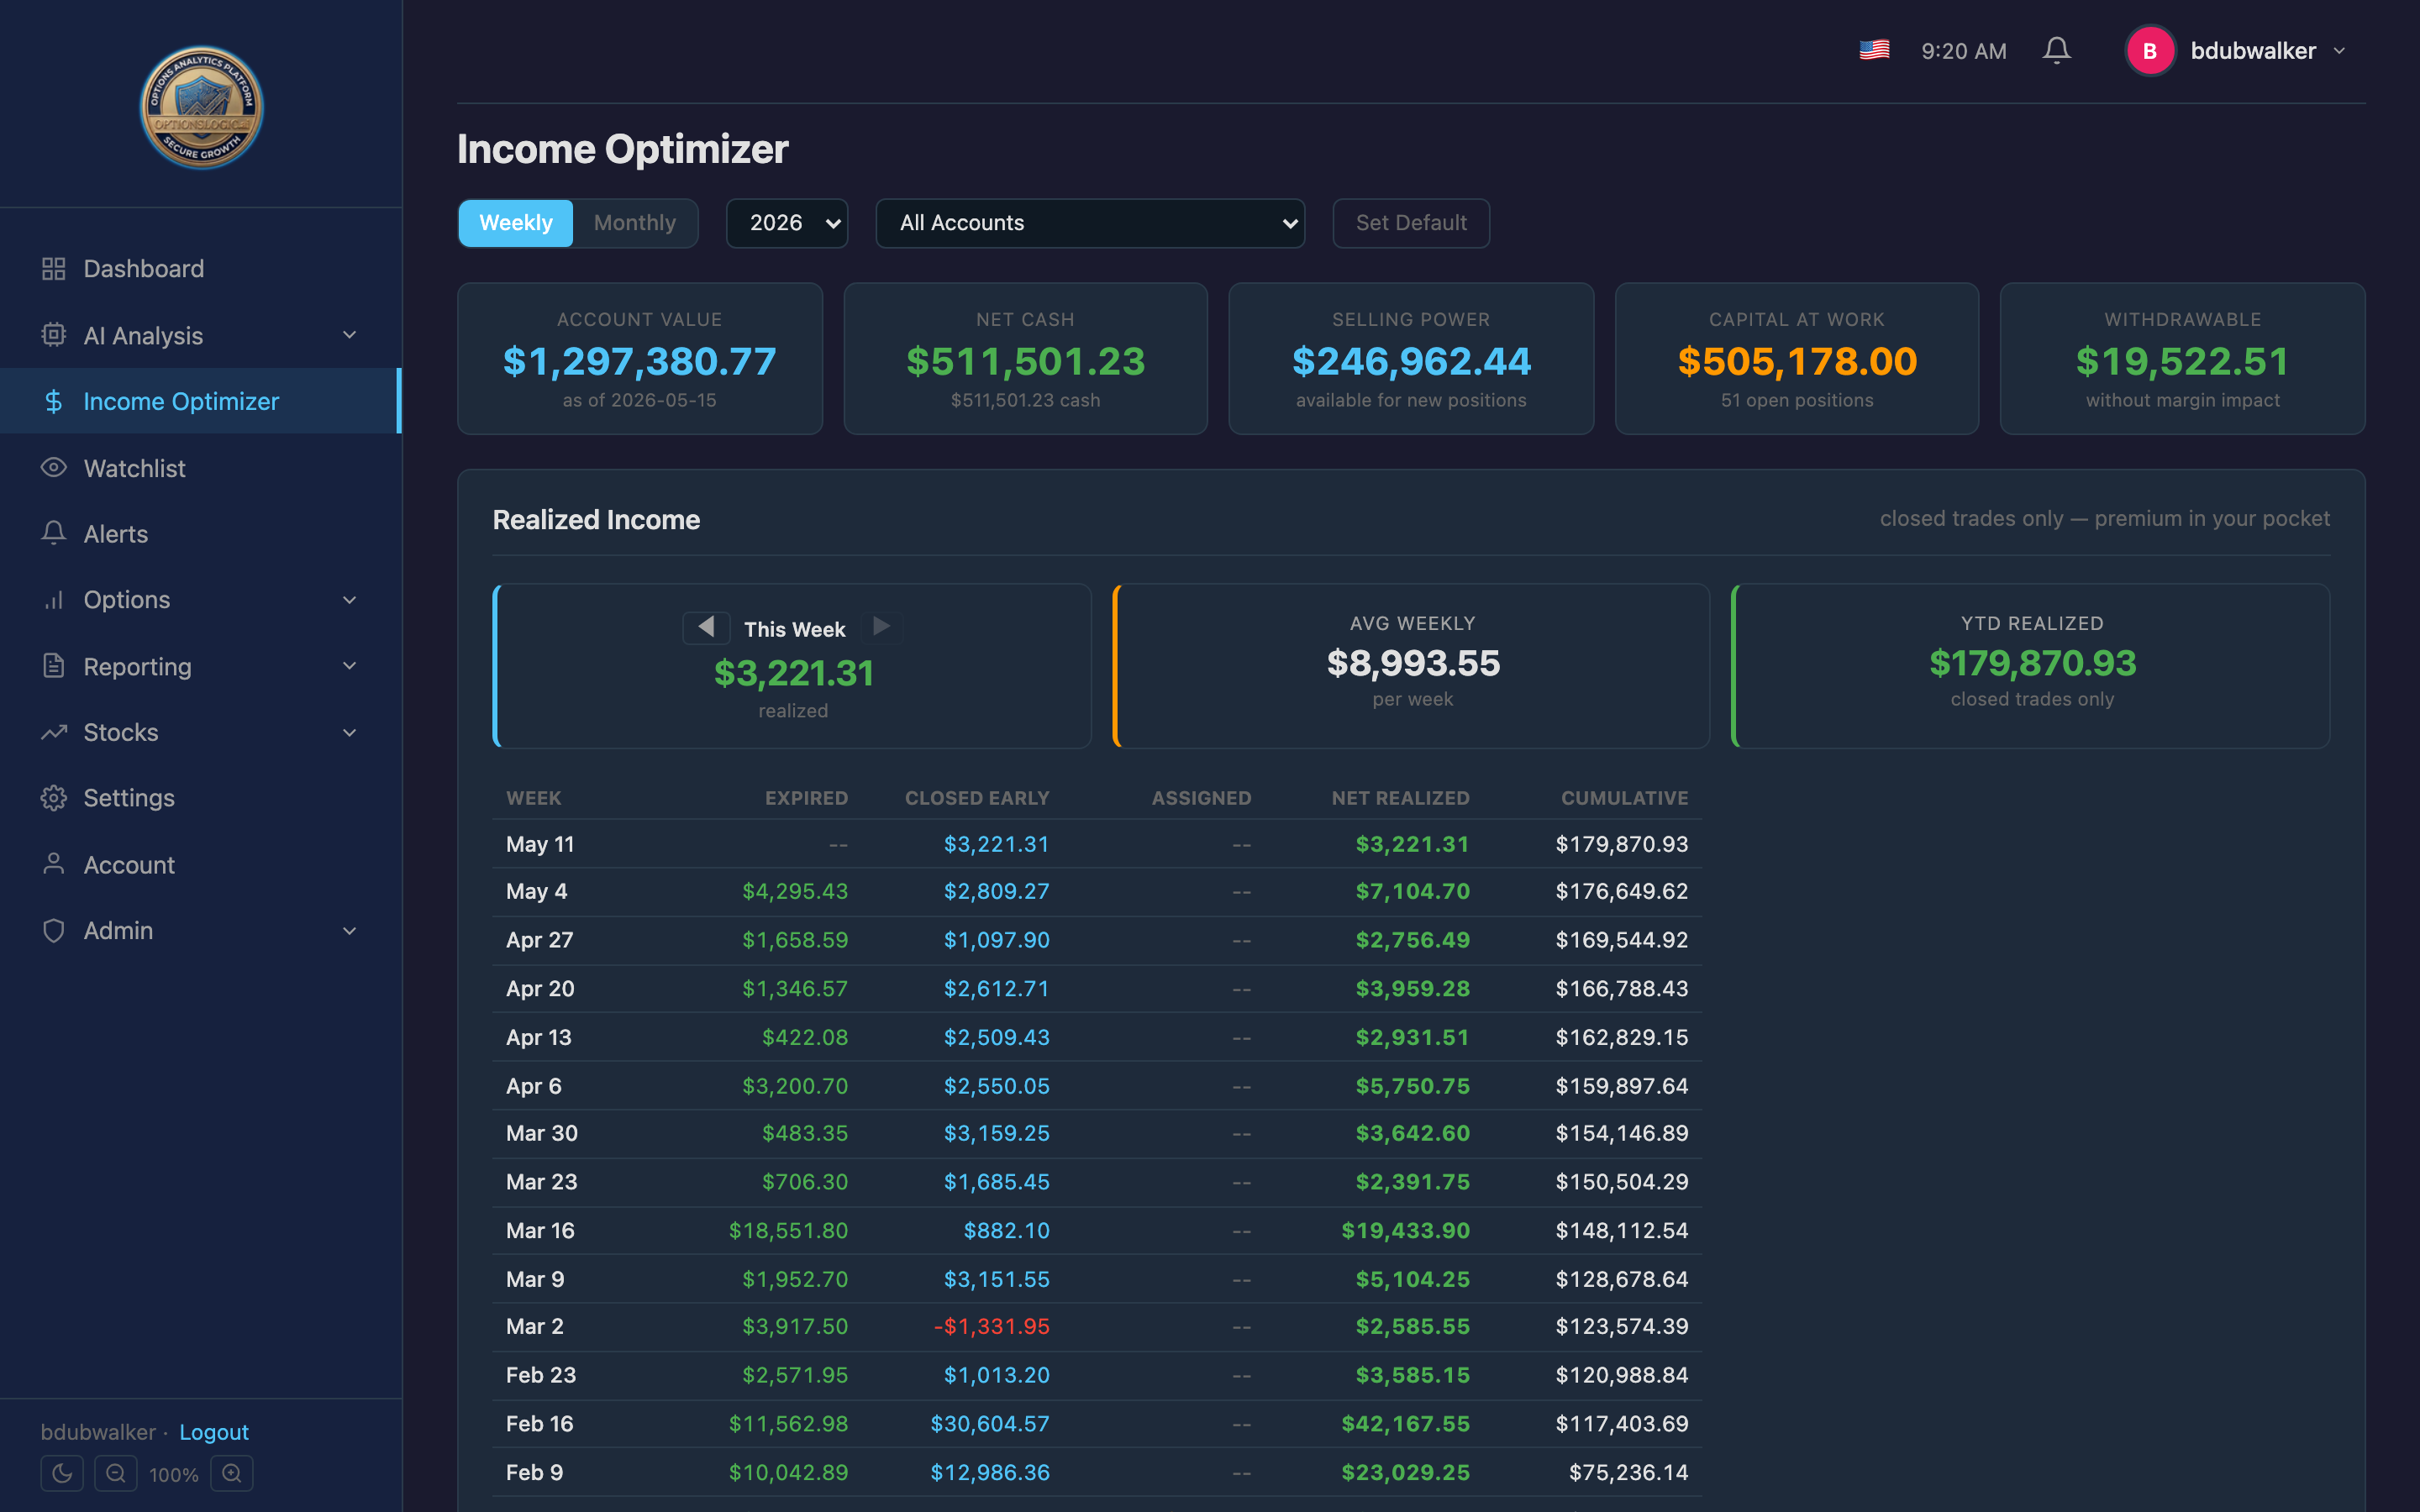
Income Optimizer
The Income Optimizer is built for premium sellers. It tracks your weekly and monthly realized income with decimal-precise accounting across all accounts.
Account Snapshot
Five cards at the top show: Account Value, Net Cash, Selling Power, Capital at Work, and Withdrawable — updated from your latest Fidelity data. Use the year and account dropdowns to filter.
Realized Income Table
The main table shows weekly income breakdowns with columns for:
- Expired — full premium kept (options expired worthless)
- Closed Early — net from buy-to-close trades
- Assigned — premium from assigned positions
- Net Realized — total for the week
- Cumulative — running year-to-date total
Navigate weeks with the arrow buttons. The Avg Weekly and YTD Realized cards give you at-a-glance income metrics.
Open Positions
Below the income table, all currently open positions are listed with ticker, strategy, strike, expiration, DTE, contracts, premium, and capital held. Click a row to see more details.
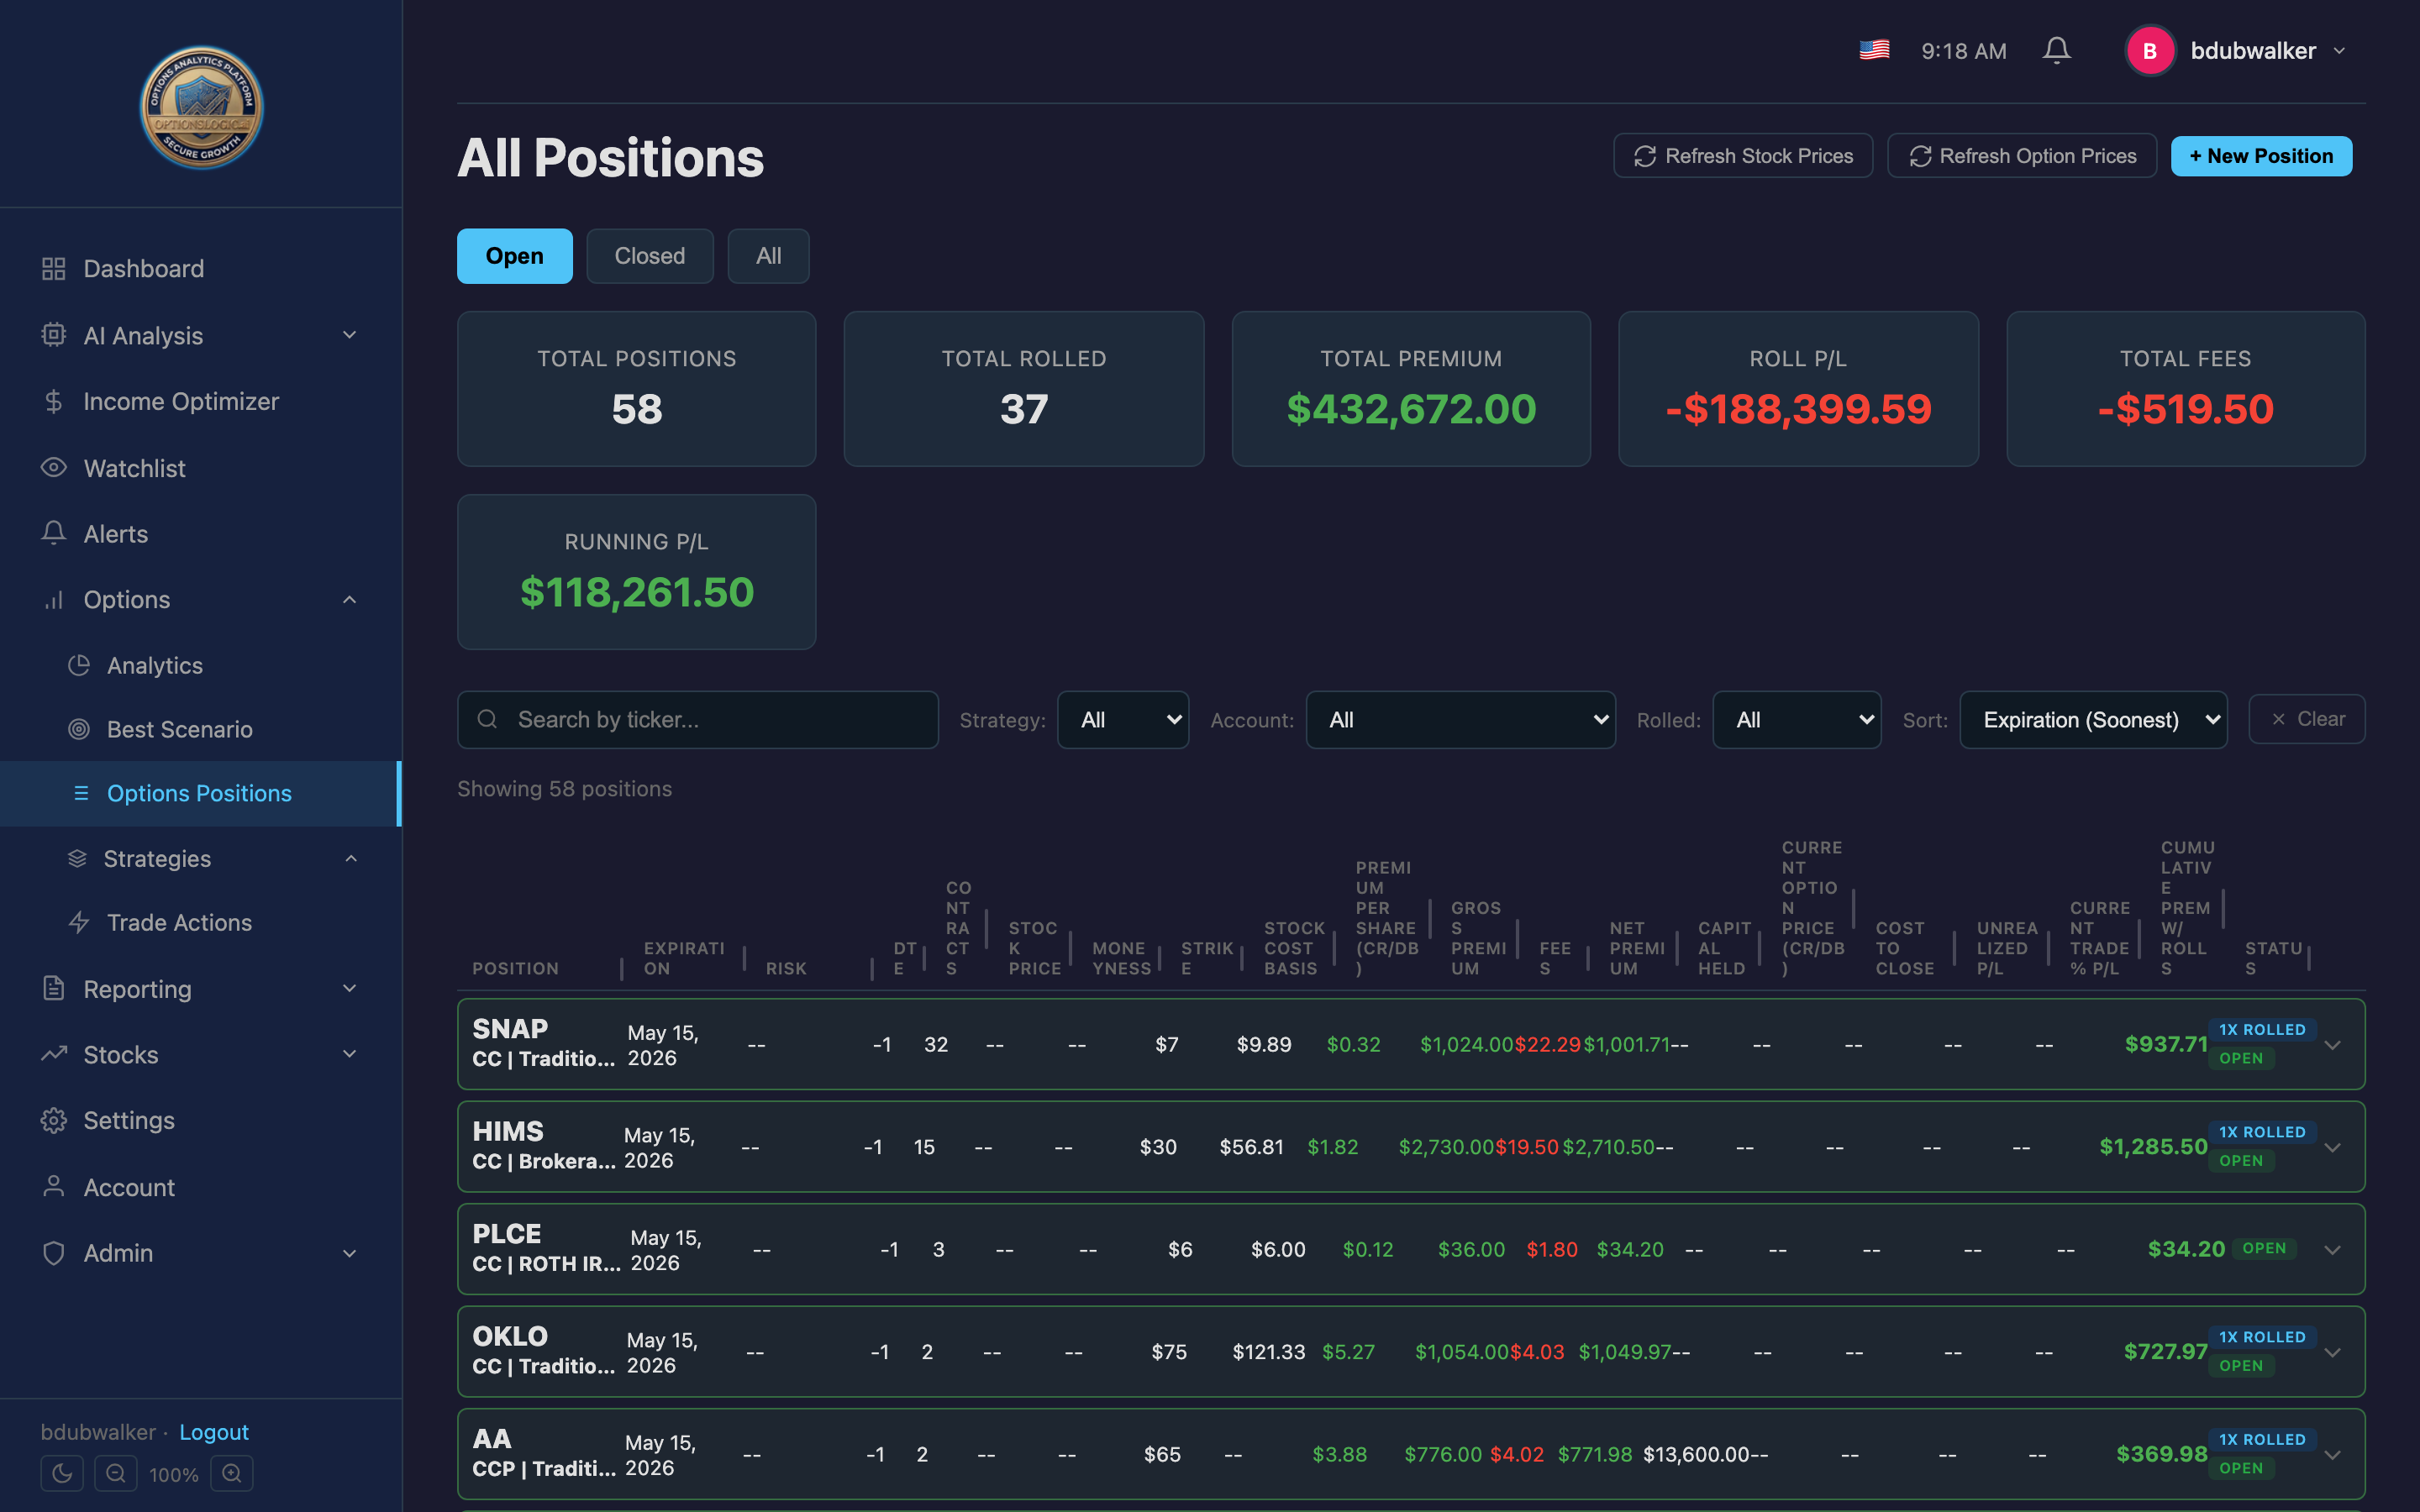
Options Positions
The Options Positions page is your central hub for tracking every open, closed, and rolled position across all accounts and strategies.
Key Features
- Filter and sort by account, strategy type, status (open/closed), and ticker
- Moneyness indicators — color-coded ITM/OTM badges with percentage from strike
- DTE tracking — days to expiration with urgency coloring
- P&L display — realized and unrealized profit/loss per position
- Capital held — how much cash each position ties up
- Resizable columns — drag column borders to customize your layout (persists across sessions)
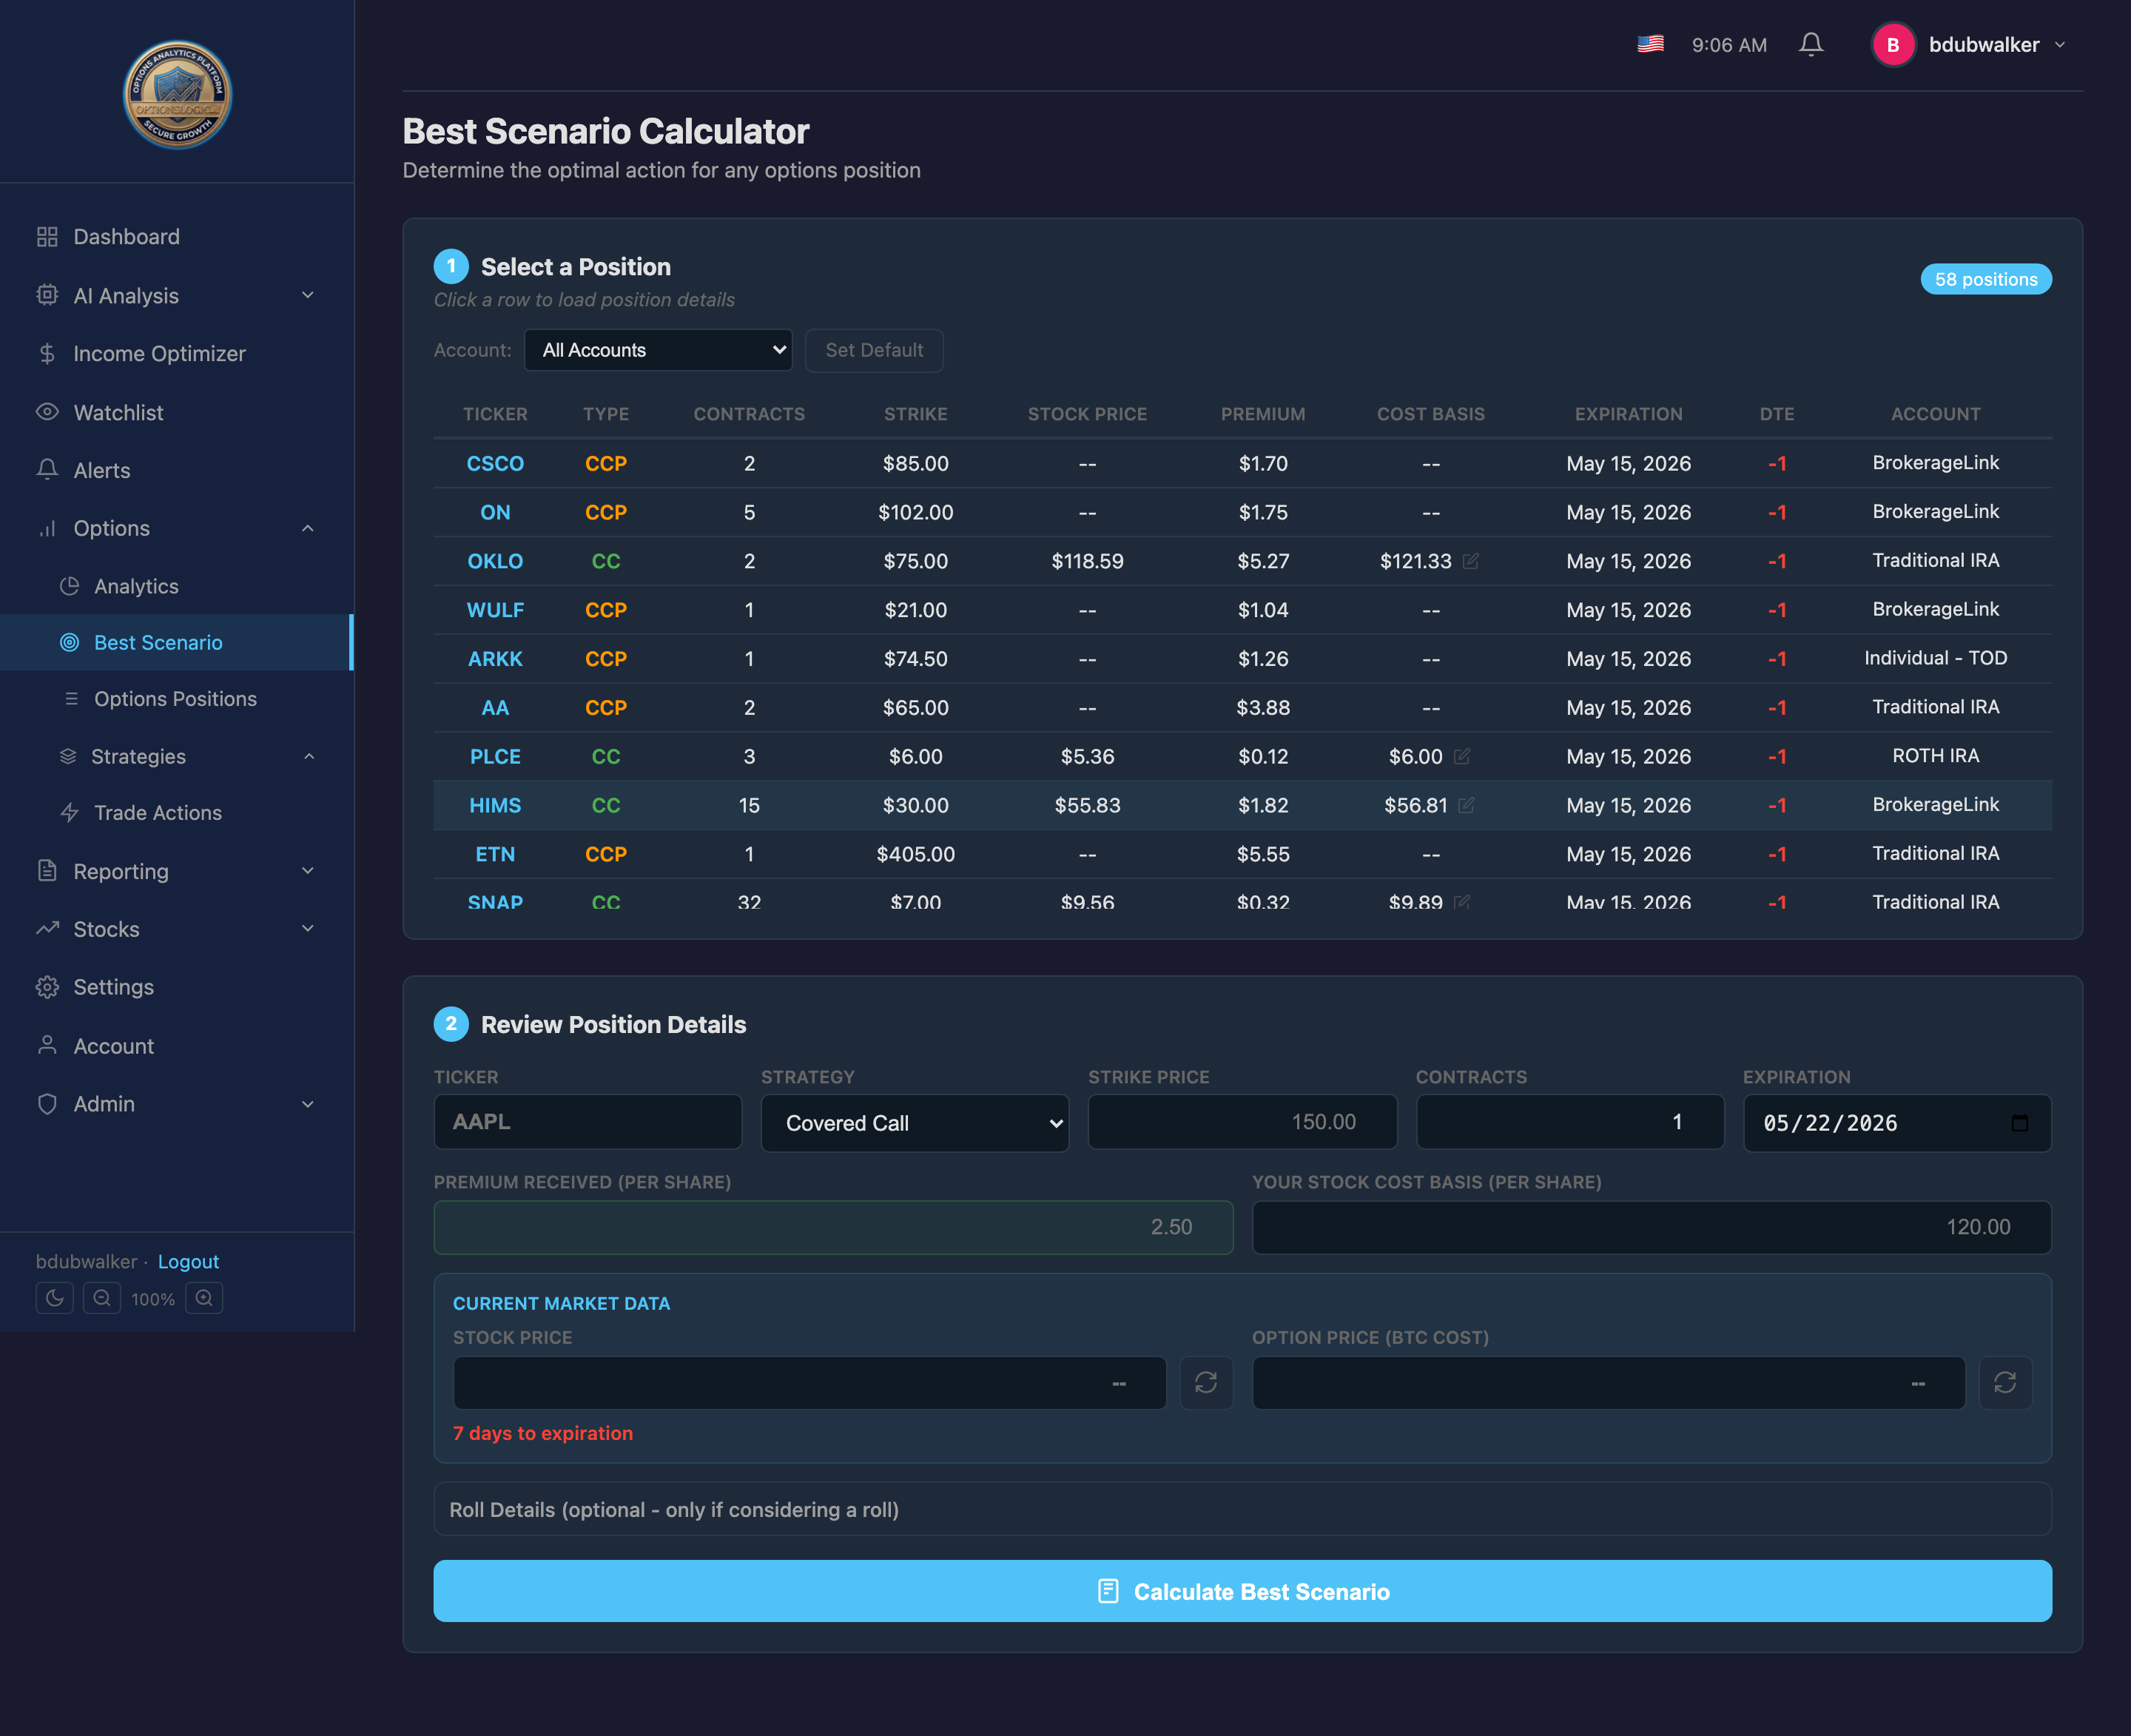
Best Scenario Calculator
When a position nears expiration, the Best Scenario Calculator compares every possible path forward so you can pick the one that maximizes value.
Five Scenarios Compared
- Let Expire Worthless — keep full premium (only valid if OTM)
- Close Option (BTC) — buy back at current price, keep shares/cash
- Close Early (BTC + Sell) — buy back and sell underlying stock
- Let Get Exercised — assignment at strike (only valid if ITM)
- Roll the Option — close current and open new position
How to Use
- Select a position from the dropdown or search by ticker.
- Enter the current stock price and option BTC price (auto-fetched when available).
- Optionally enter a roll strike and premium, or let the system auto-generate top roll candidates.
- Click Calculate to see all five scenarios ranked by P&L with pros and cons for each.
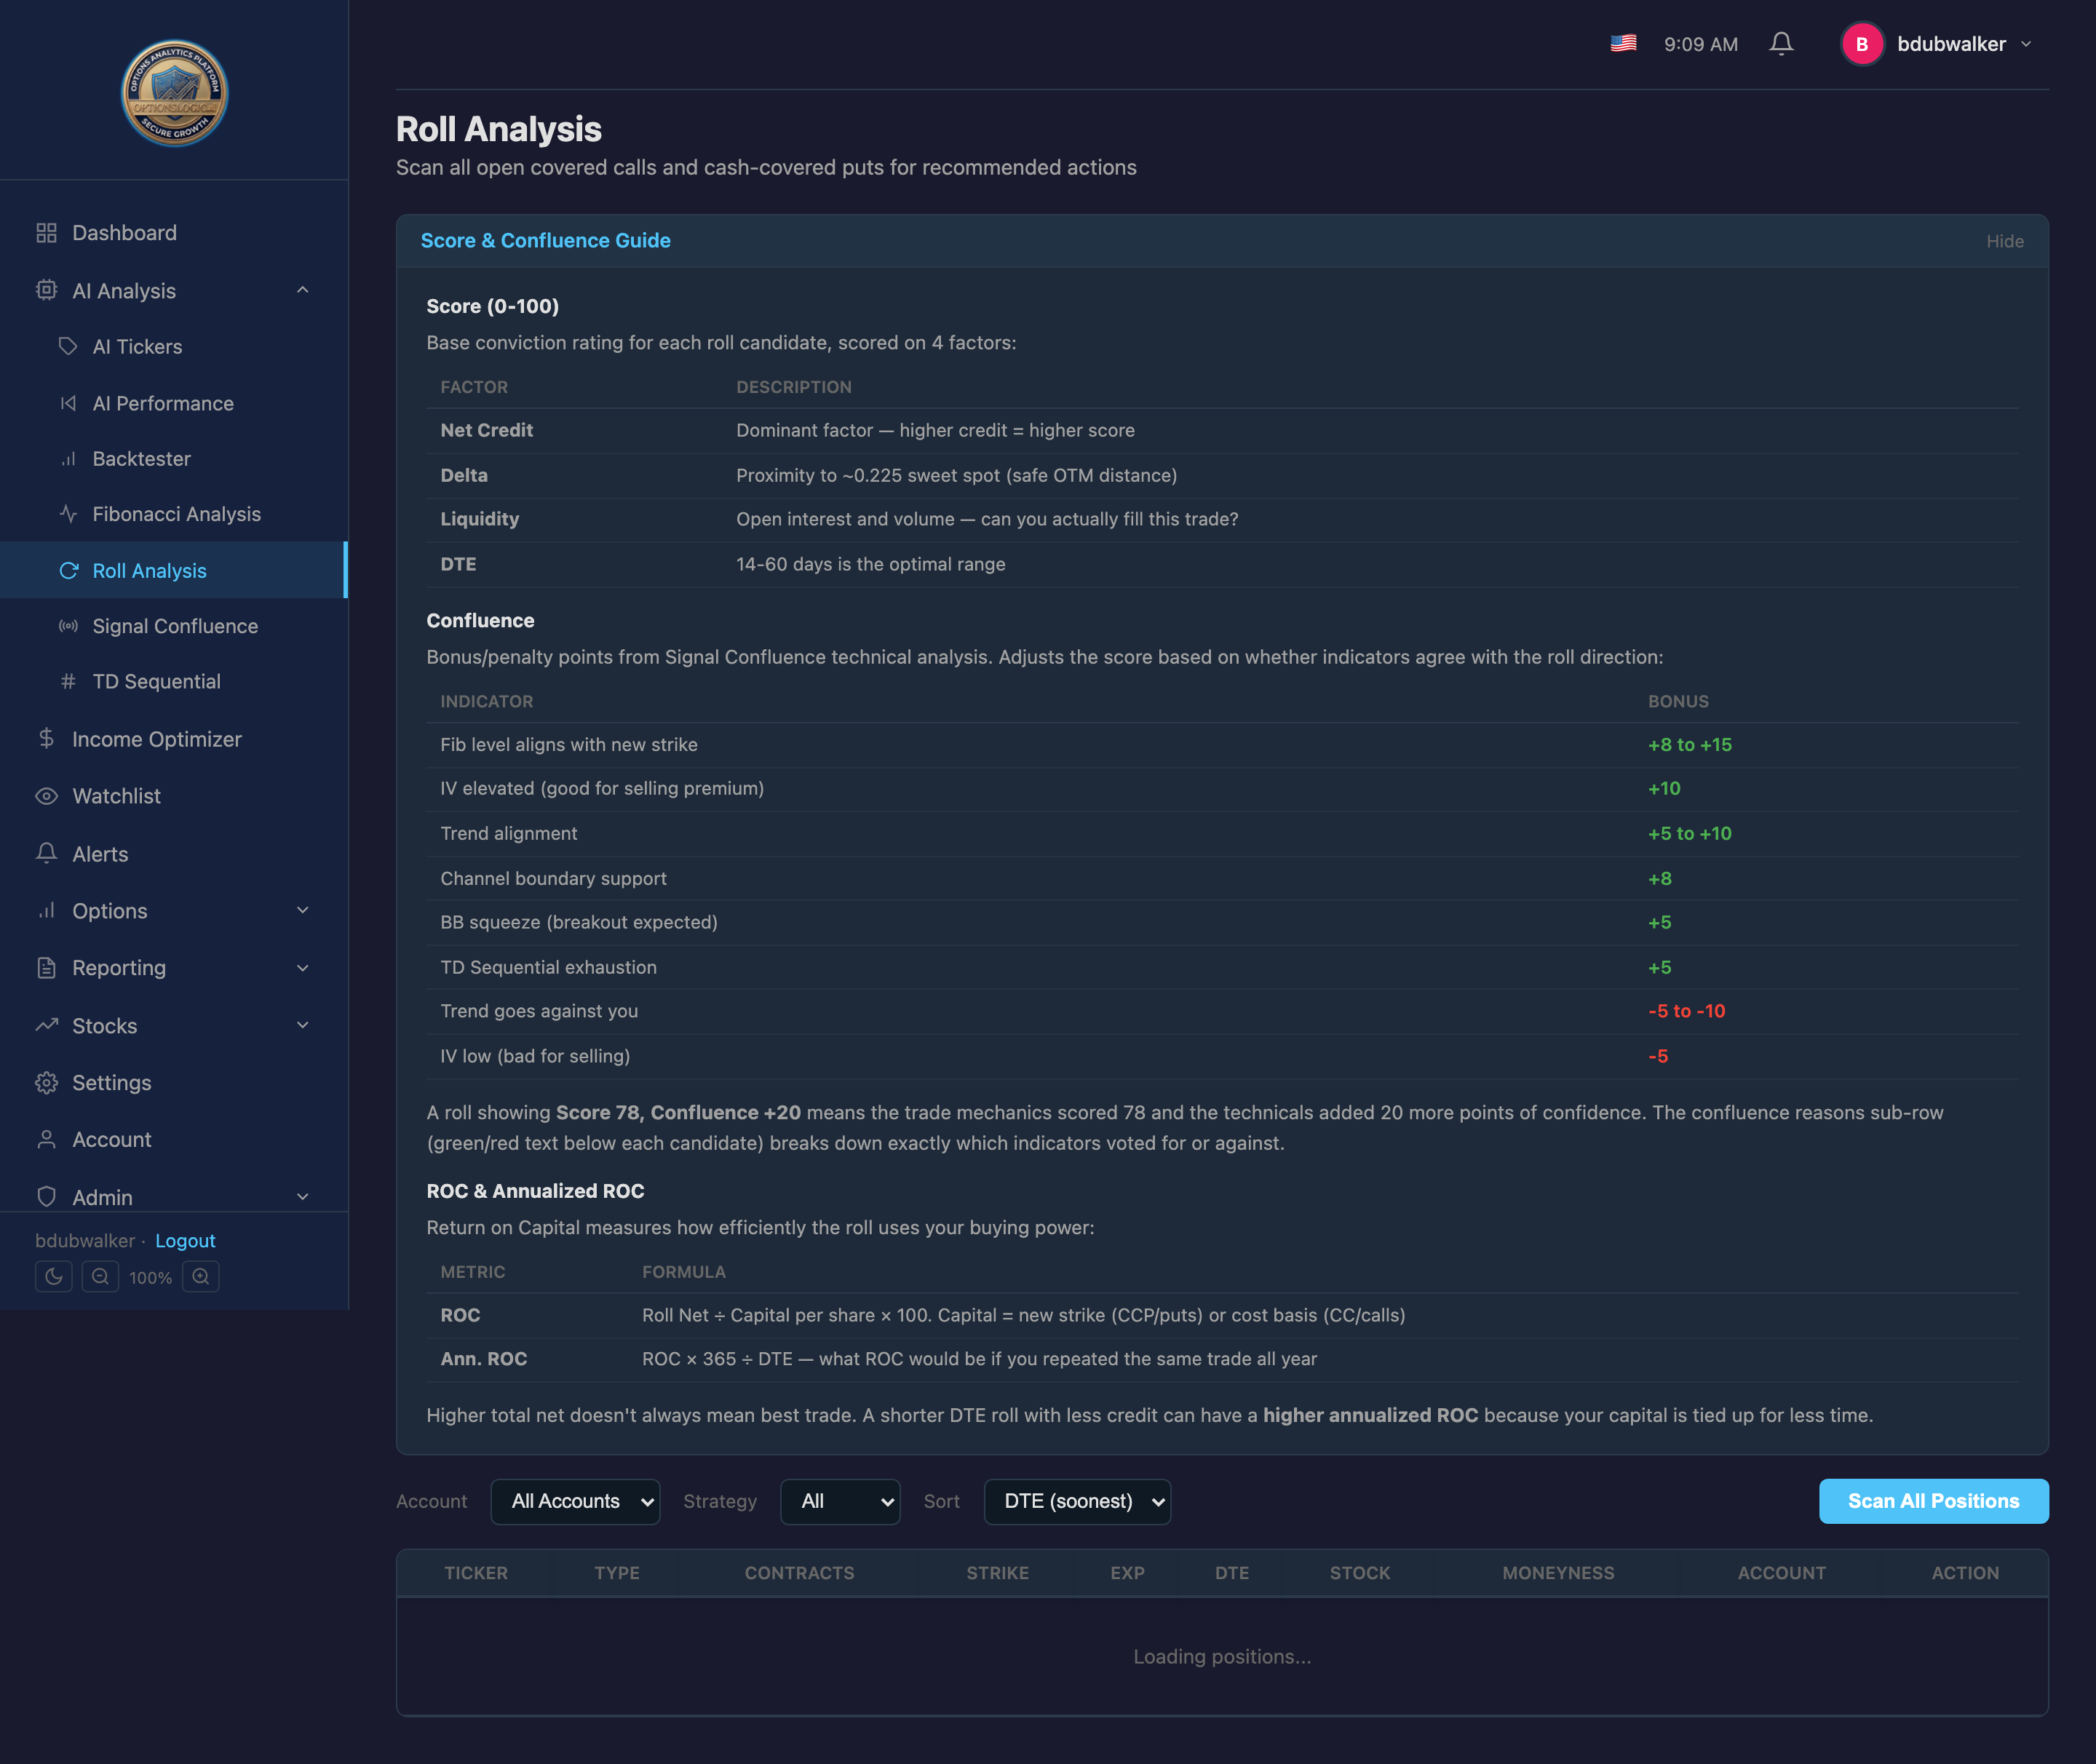
Roll Analysis
Roll Analysis provides a bulk view of all your open positions with proactive recommendations on which ones need attention — ITM, expiring soon, or ripe for a roll.
Summary Banner
At the top, cards show: total positions, ITM count, expiring within 7 days, and safe OTM count.
Position Table
Each row shows ticker, strategy, contracts, strike, expiration, DTE, stock price, and moneyness percentage. Color coding highlights urgency: red for ITM, yellow for expiring soon, green for safe.
Per-Position Analysis
- Click Analyze on any row to see a recommended action (Roll, Expire, Close, or Exercise) with a confidence score.
- View the top 3 roll candidates with strike, expiration, estimated premium, roll credit, ROC, annualized ROC, delta, and conviction score.
- Technical confluence data (Fib levels, IV status, trend, BB squeeze) backs each recommendation.
Batch Scan
Click Scan All Positions to analyze your entire portfolio at once. A progress bar shows real-time status, and the final summary groups positions by recommended action.
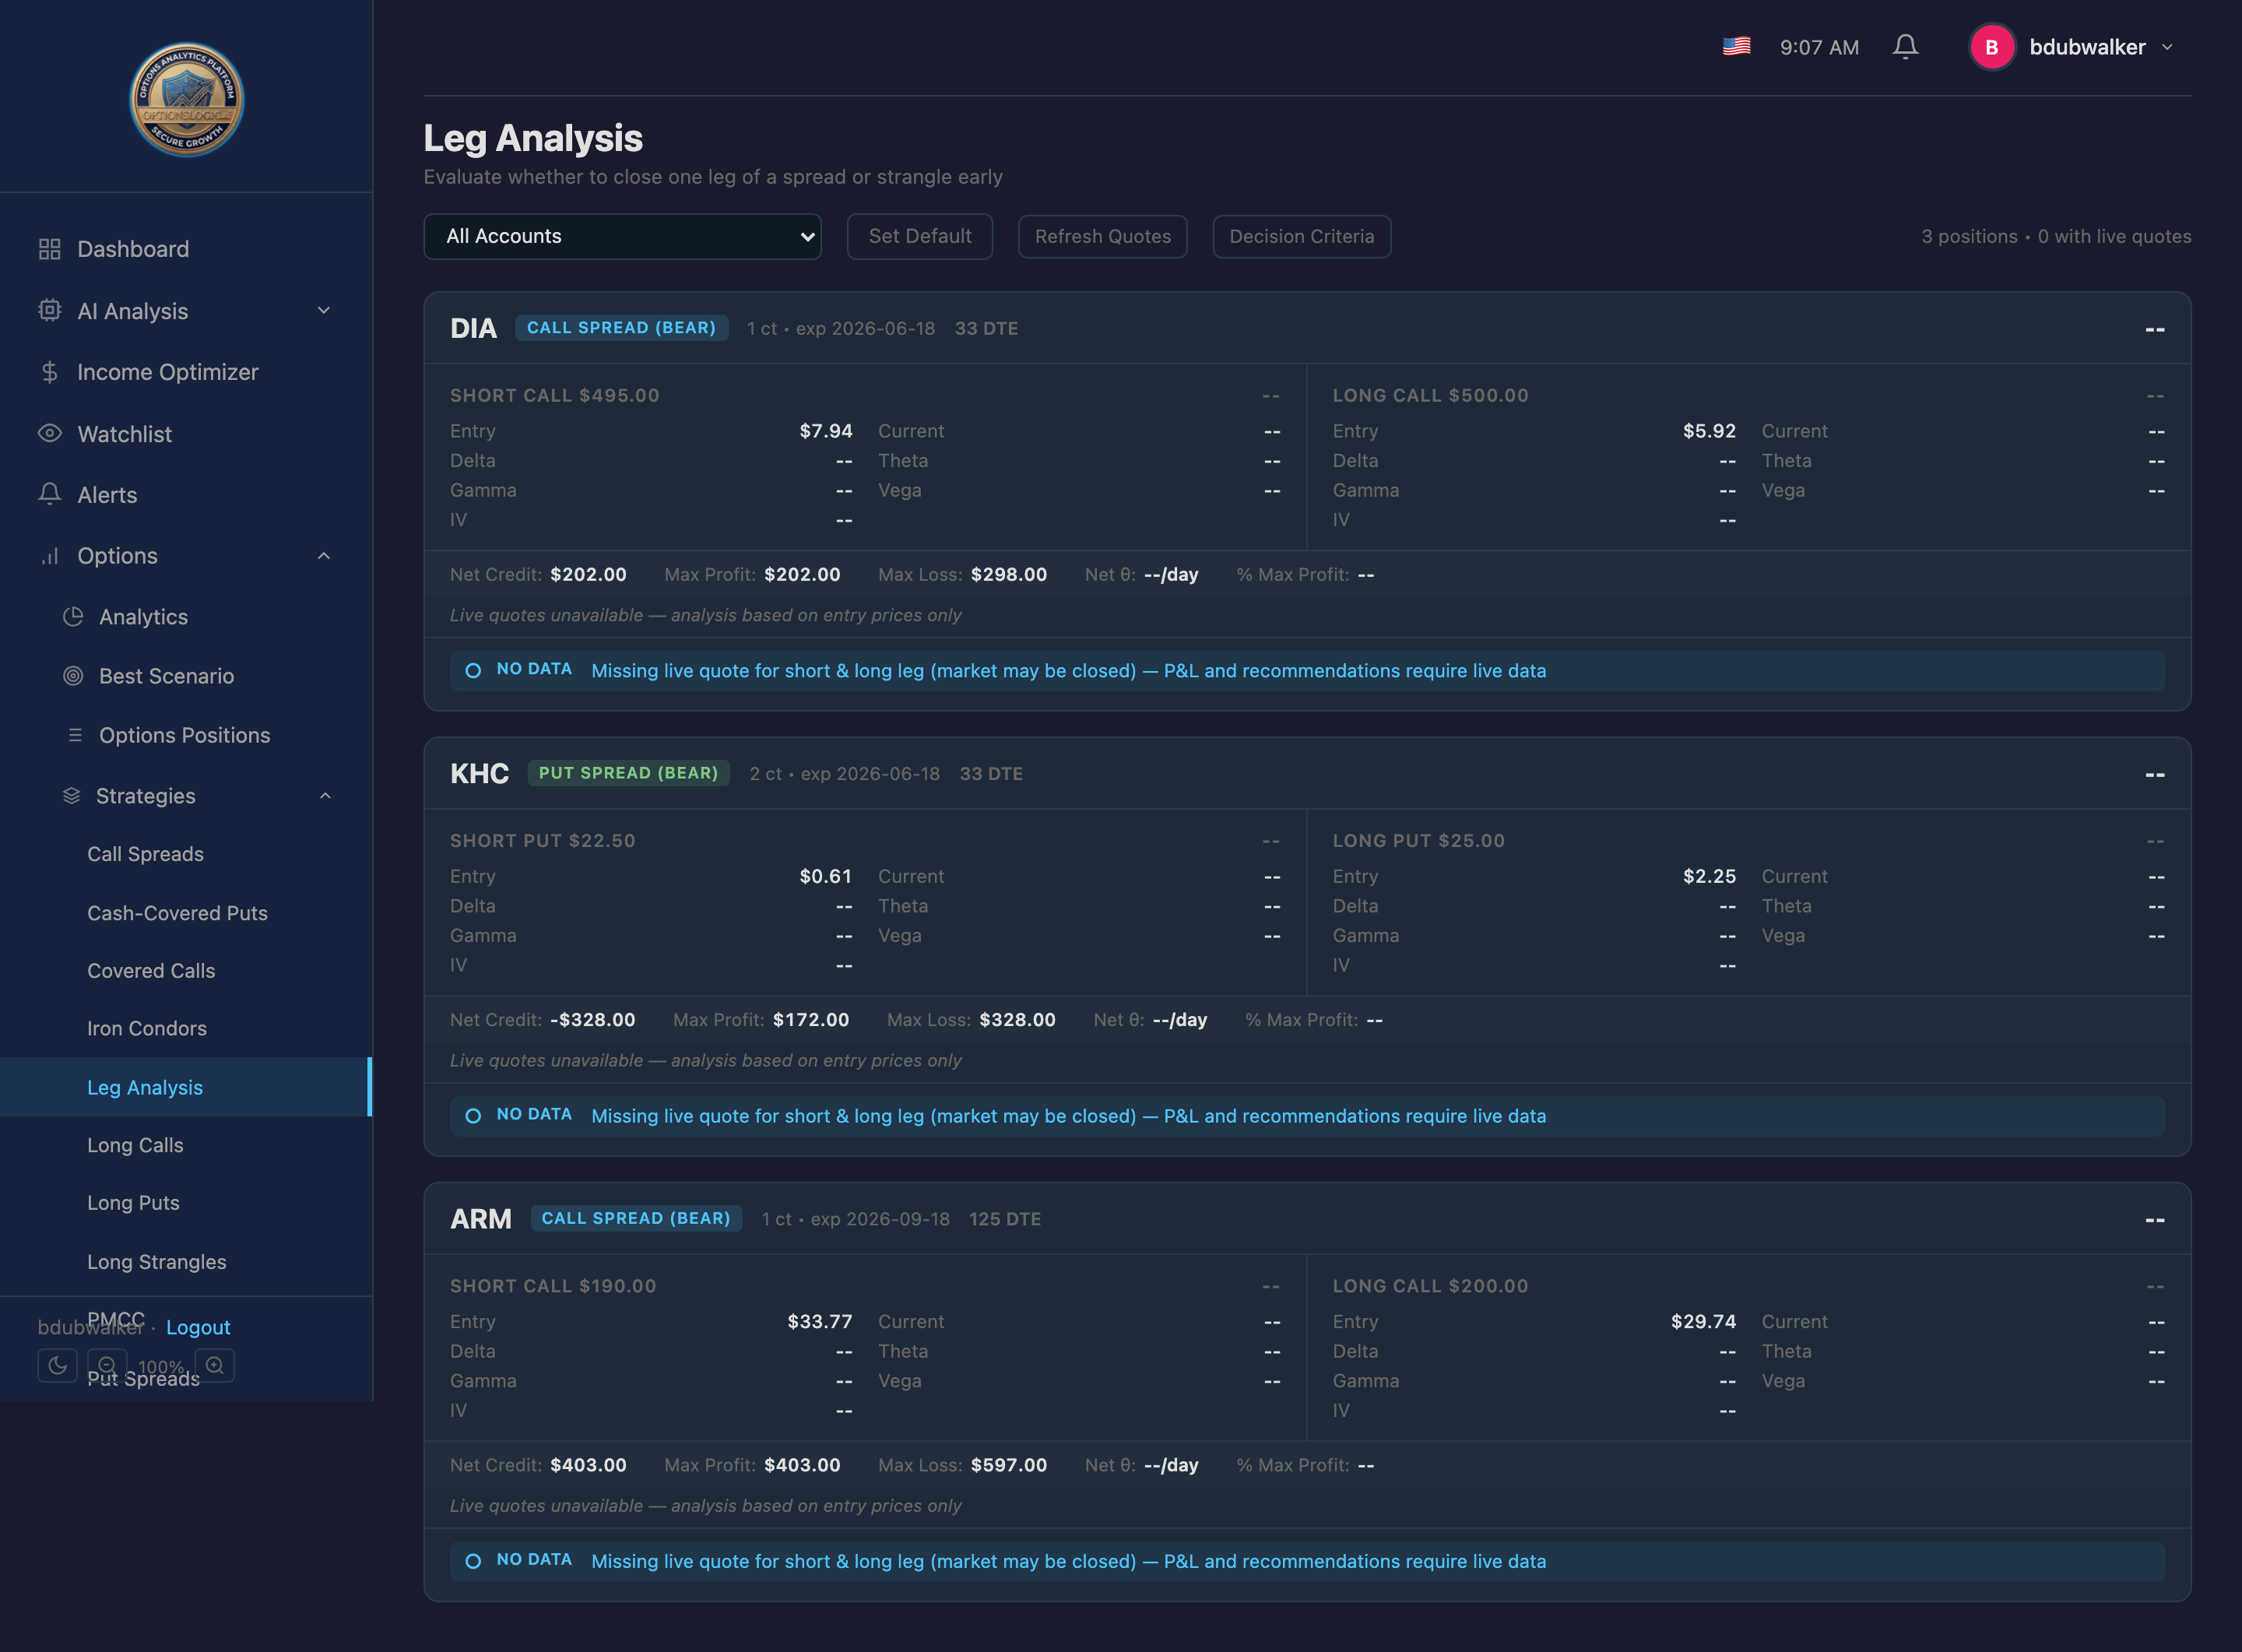
Leg Analysis
Leg Analysis provides detailed verdicts on multi-leg positions (spreads, condors, PMCC). It evaluates the net Greeks, moneyness of each leg, and delivers actionable recommendations.
- Net theta analysis — is time decay working for or against you?
- Spread width and max risk — clear P&L boundaries
- Decision criteria — when to hold, when to close, when to roll
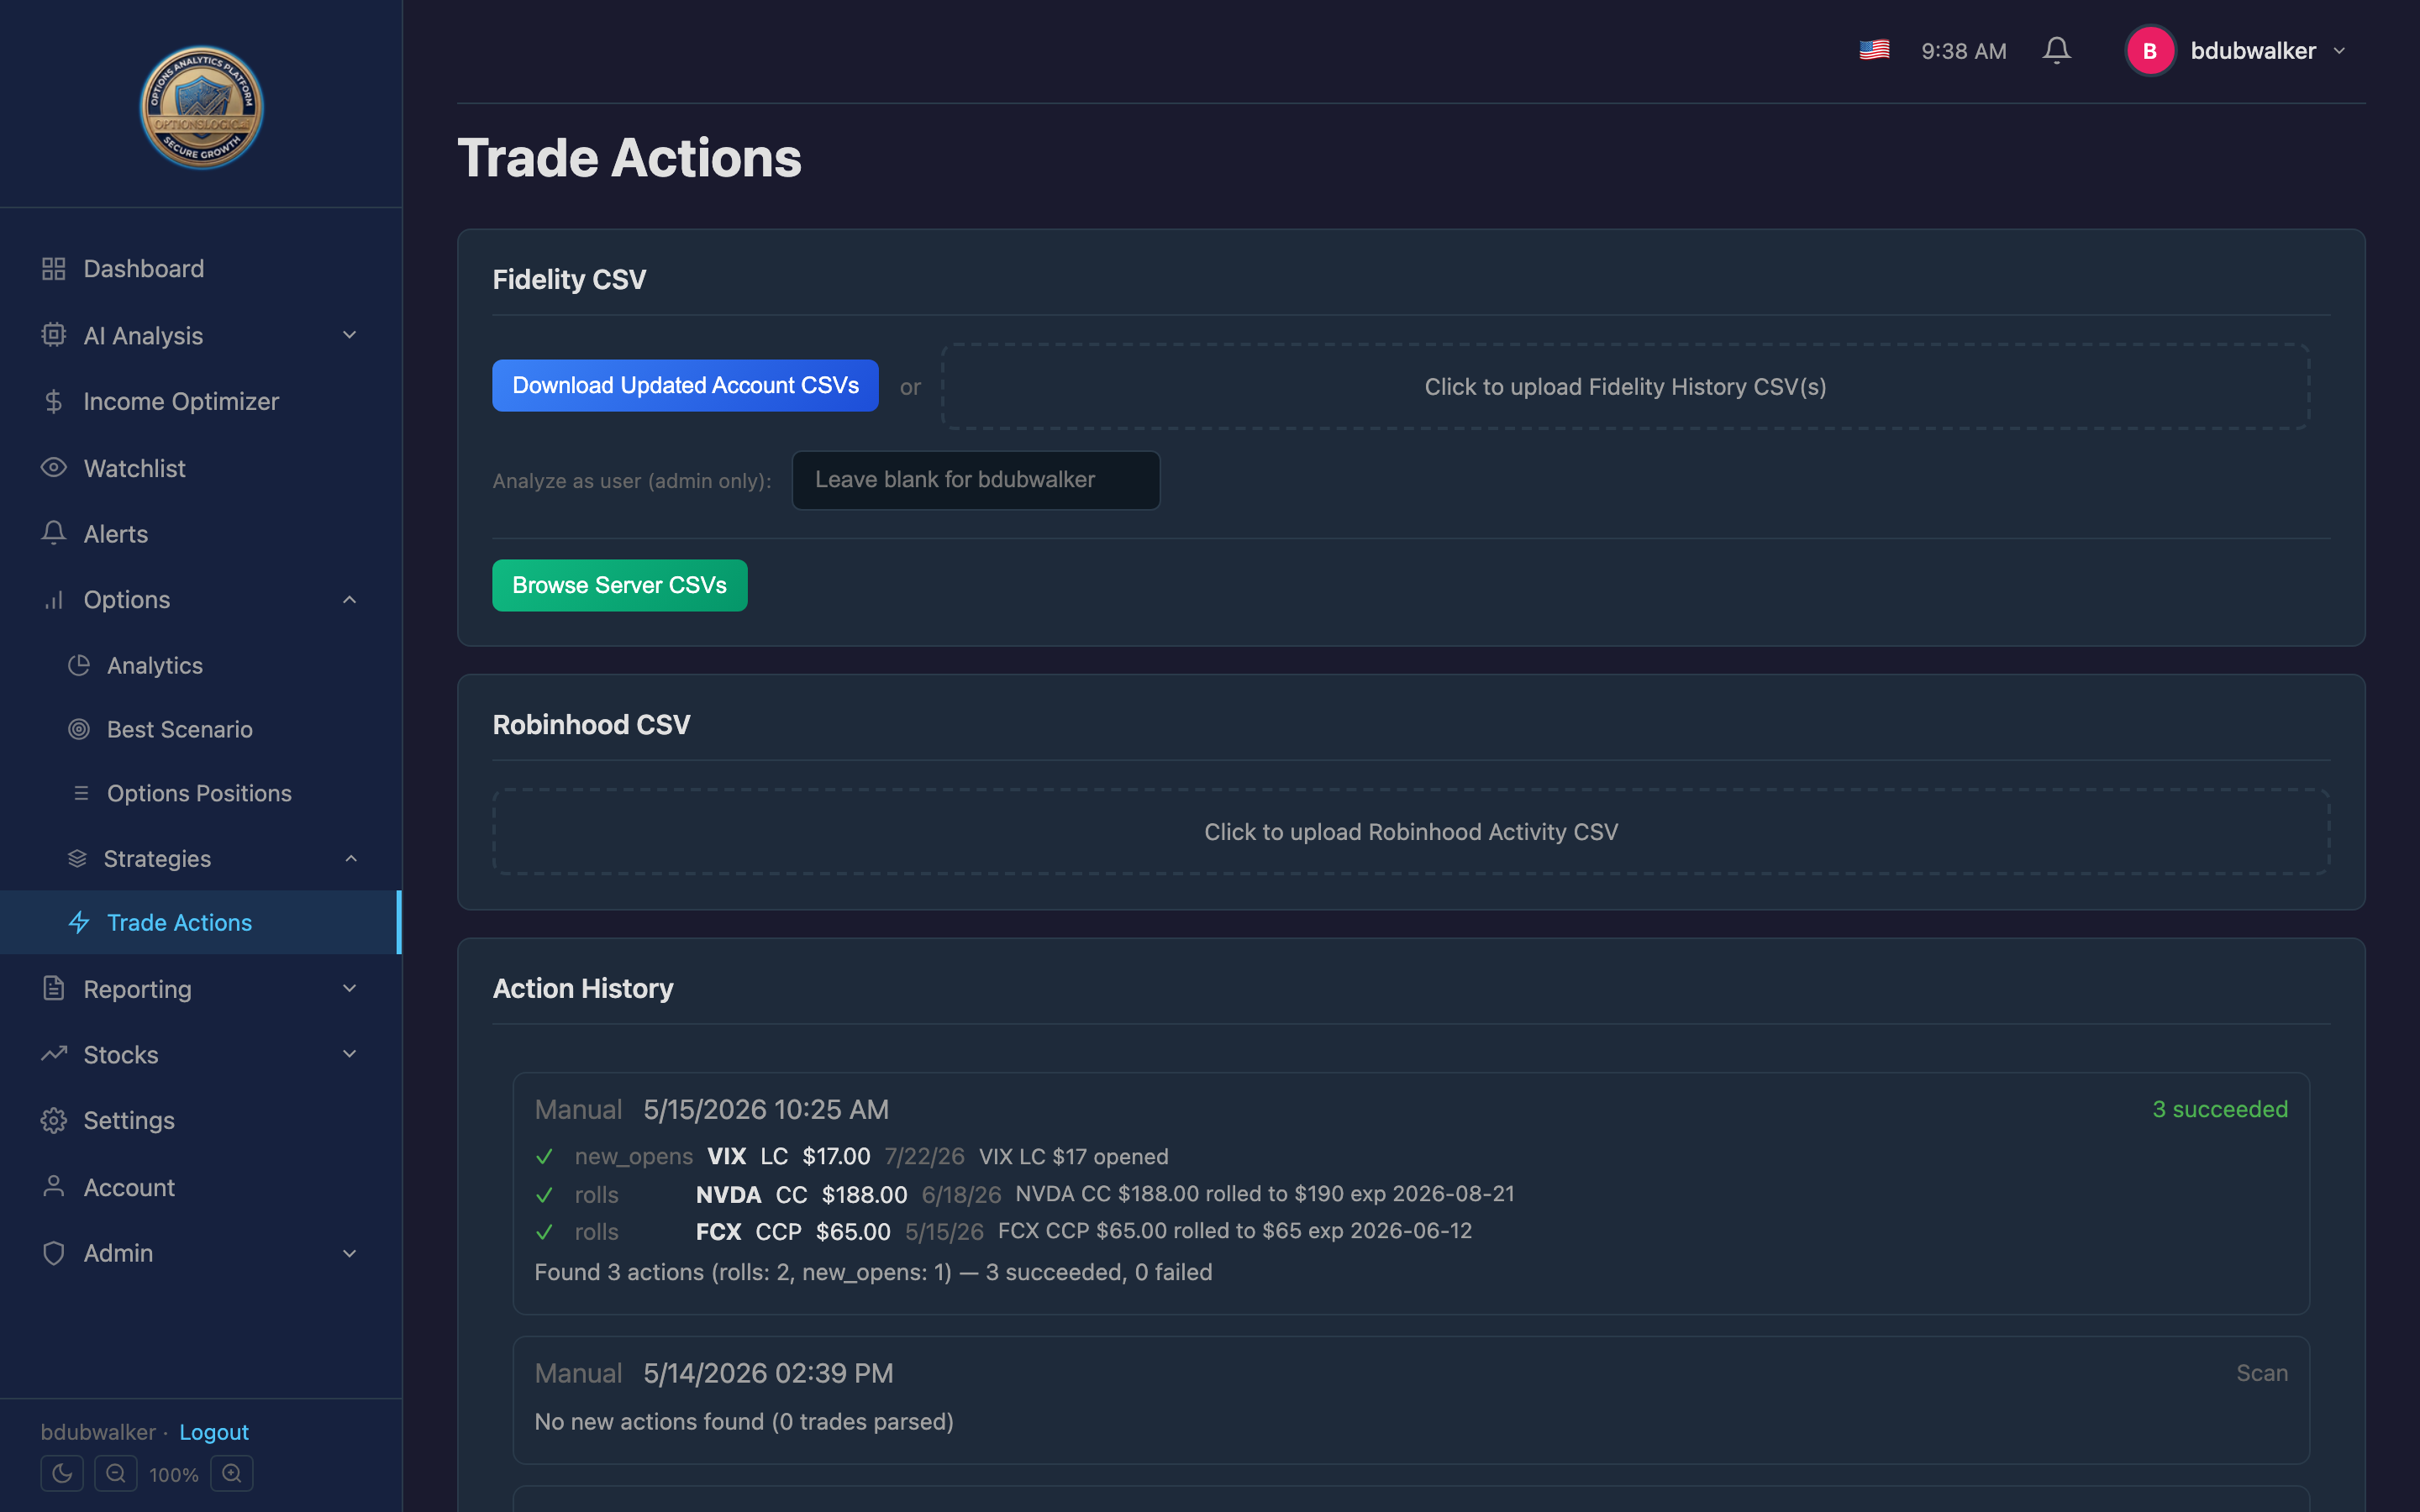
Trade Actions
Trade Actions handles automated reconciliation between your brokerage data and the OptionsLogic.AI PRISM position database. When you import Fidelity CSV data, Trade Actions detects what changed.
What It Detects
- Expired — options that expired worthless
- Assigned — options that were exercised
- Closed early (BTC) — positions you bought to close
- Rolls — close + reopen detected as a roll
- New opens — new positions opened since last import
- Missing from broker — positions in the DB not found in Fidelity data

The Action History section at the bottom (visible in the screenshot above) logs every processed batch with timestamps and success counts. Each entry shows the individual trades detected — new opens, rolls, and closes — so you have a full audit trail.
Back to topWatchlist
The Watchlist lets you monitor tickers you're interested in without committing to a position. Add tickers and track live prices and technical levels.
- Click Add Ticker and enter a symbol.
- View live price data and key levels for each ticker.
- Remove tickers you're no longer watching.
Alerts & Notifications
Set up alerts that trigger when specific conditions are met. Alerts can notify you via email, in-app notifications, SMS, and Discord DM so you can monitor your trades on the go without logging in.
Alert Types
- Stock price — above or below a target
- Option price — premium threshold
- P&L threshold — dollar or percentage target
- DTE threshold — days to expiration warning
- RSI, MACD, Bollinger %B — technical indicator crossovers
- ITM/OTM % — moneyness percentage
- Trade P&L % — per-position profit target
- TD Sequential — buy/sell reversal count threshold
Alert Features
- Cooldown period — auto-snooze after triggering to avoid spam
- Sustained conditions — only trigger if the condition holds for N consecutive days
- Expiration date — alerts can auto-expire
- Notes — attach reminders to each alert
Notification Channels
- Email — styled HTML email with ticker, alert type, target vs. current value, and a link back to the alerts page
- In-App — notification bell in the top bar
- SMS — text message to your verified phone number (requires phone verification on the Account page)
- Discord — rich embed DM from the OptionsLogic.AI PRISM bot to your verified Discord account (see Link Discord for Alerts). TD Sequential alerts include buy/sell reversal signal direction.
You also receive periodic position summary emails with live prices and assignment risk flags for all open positions.
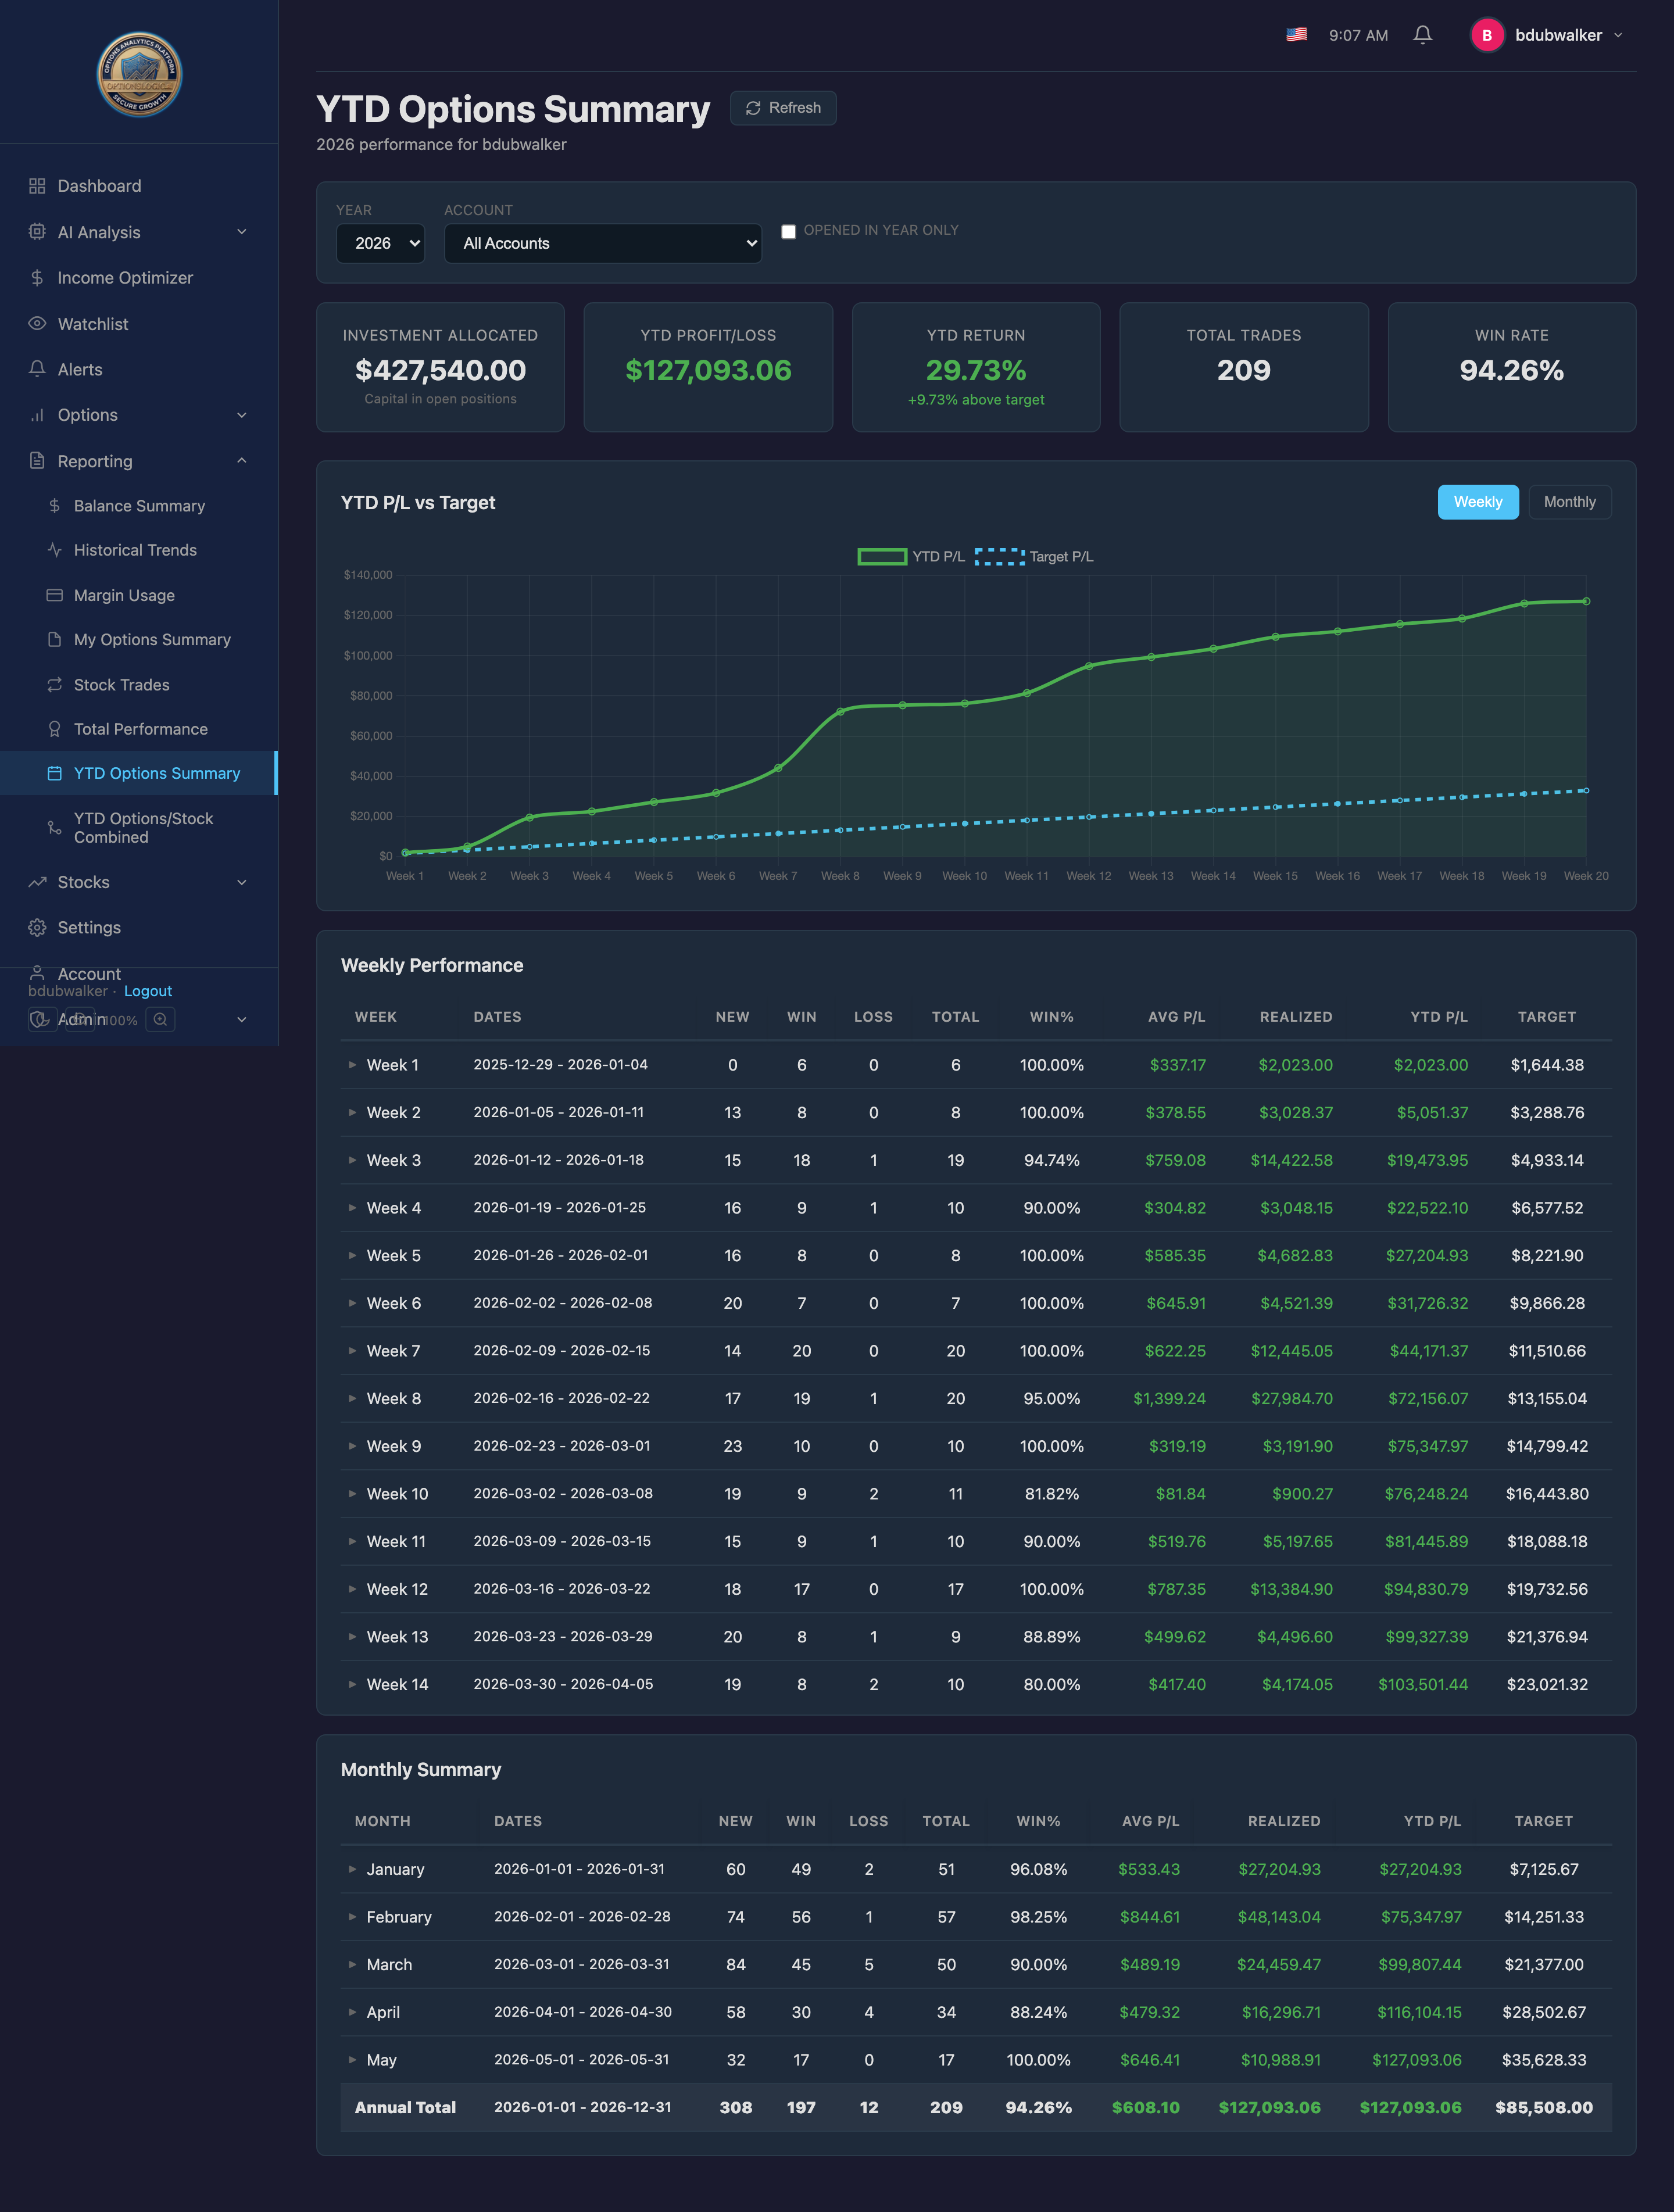
YTD Options Summary
Tracks year-to-date premium P&L from closed options trades. Shows weekly and monthly breakdowns with cumulative totals, and includes full roll chain history for rolled positions.
- Monthly rows — expand to show individual weeks
- Weekly rows — expand to show each trade
- Roll chains — see every leg of a rolled position in sequence
- Win rate and average P&L per trade
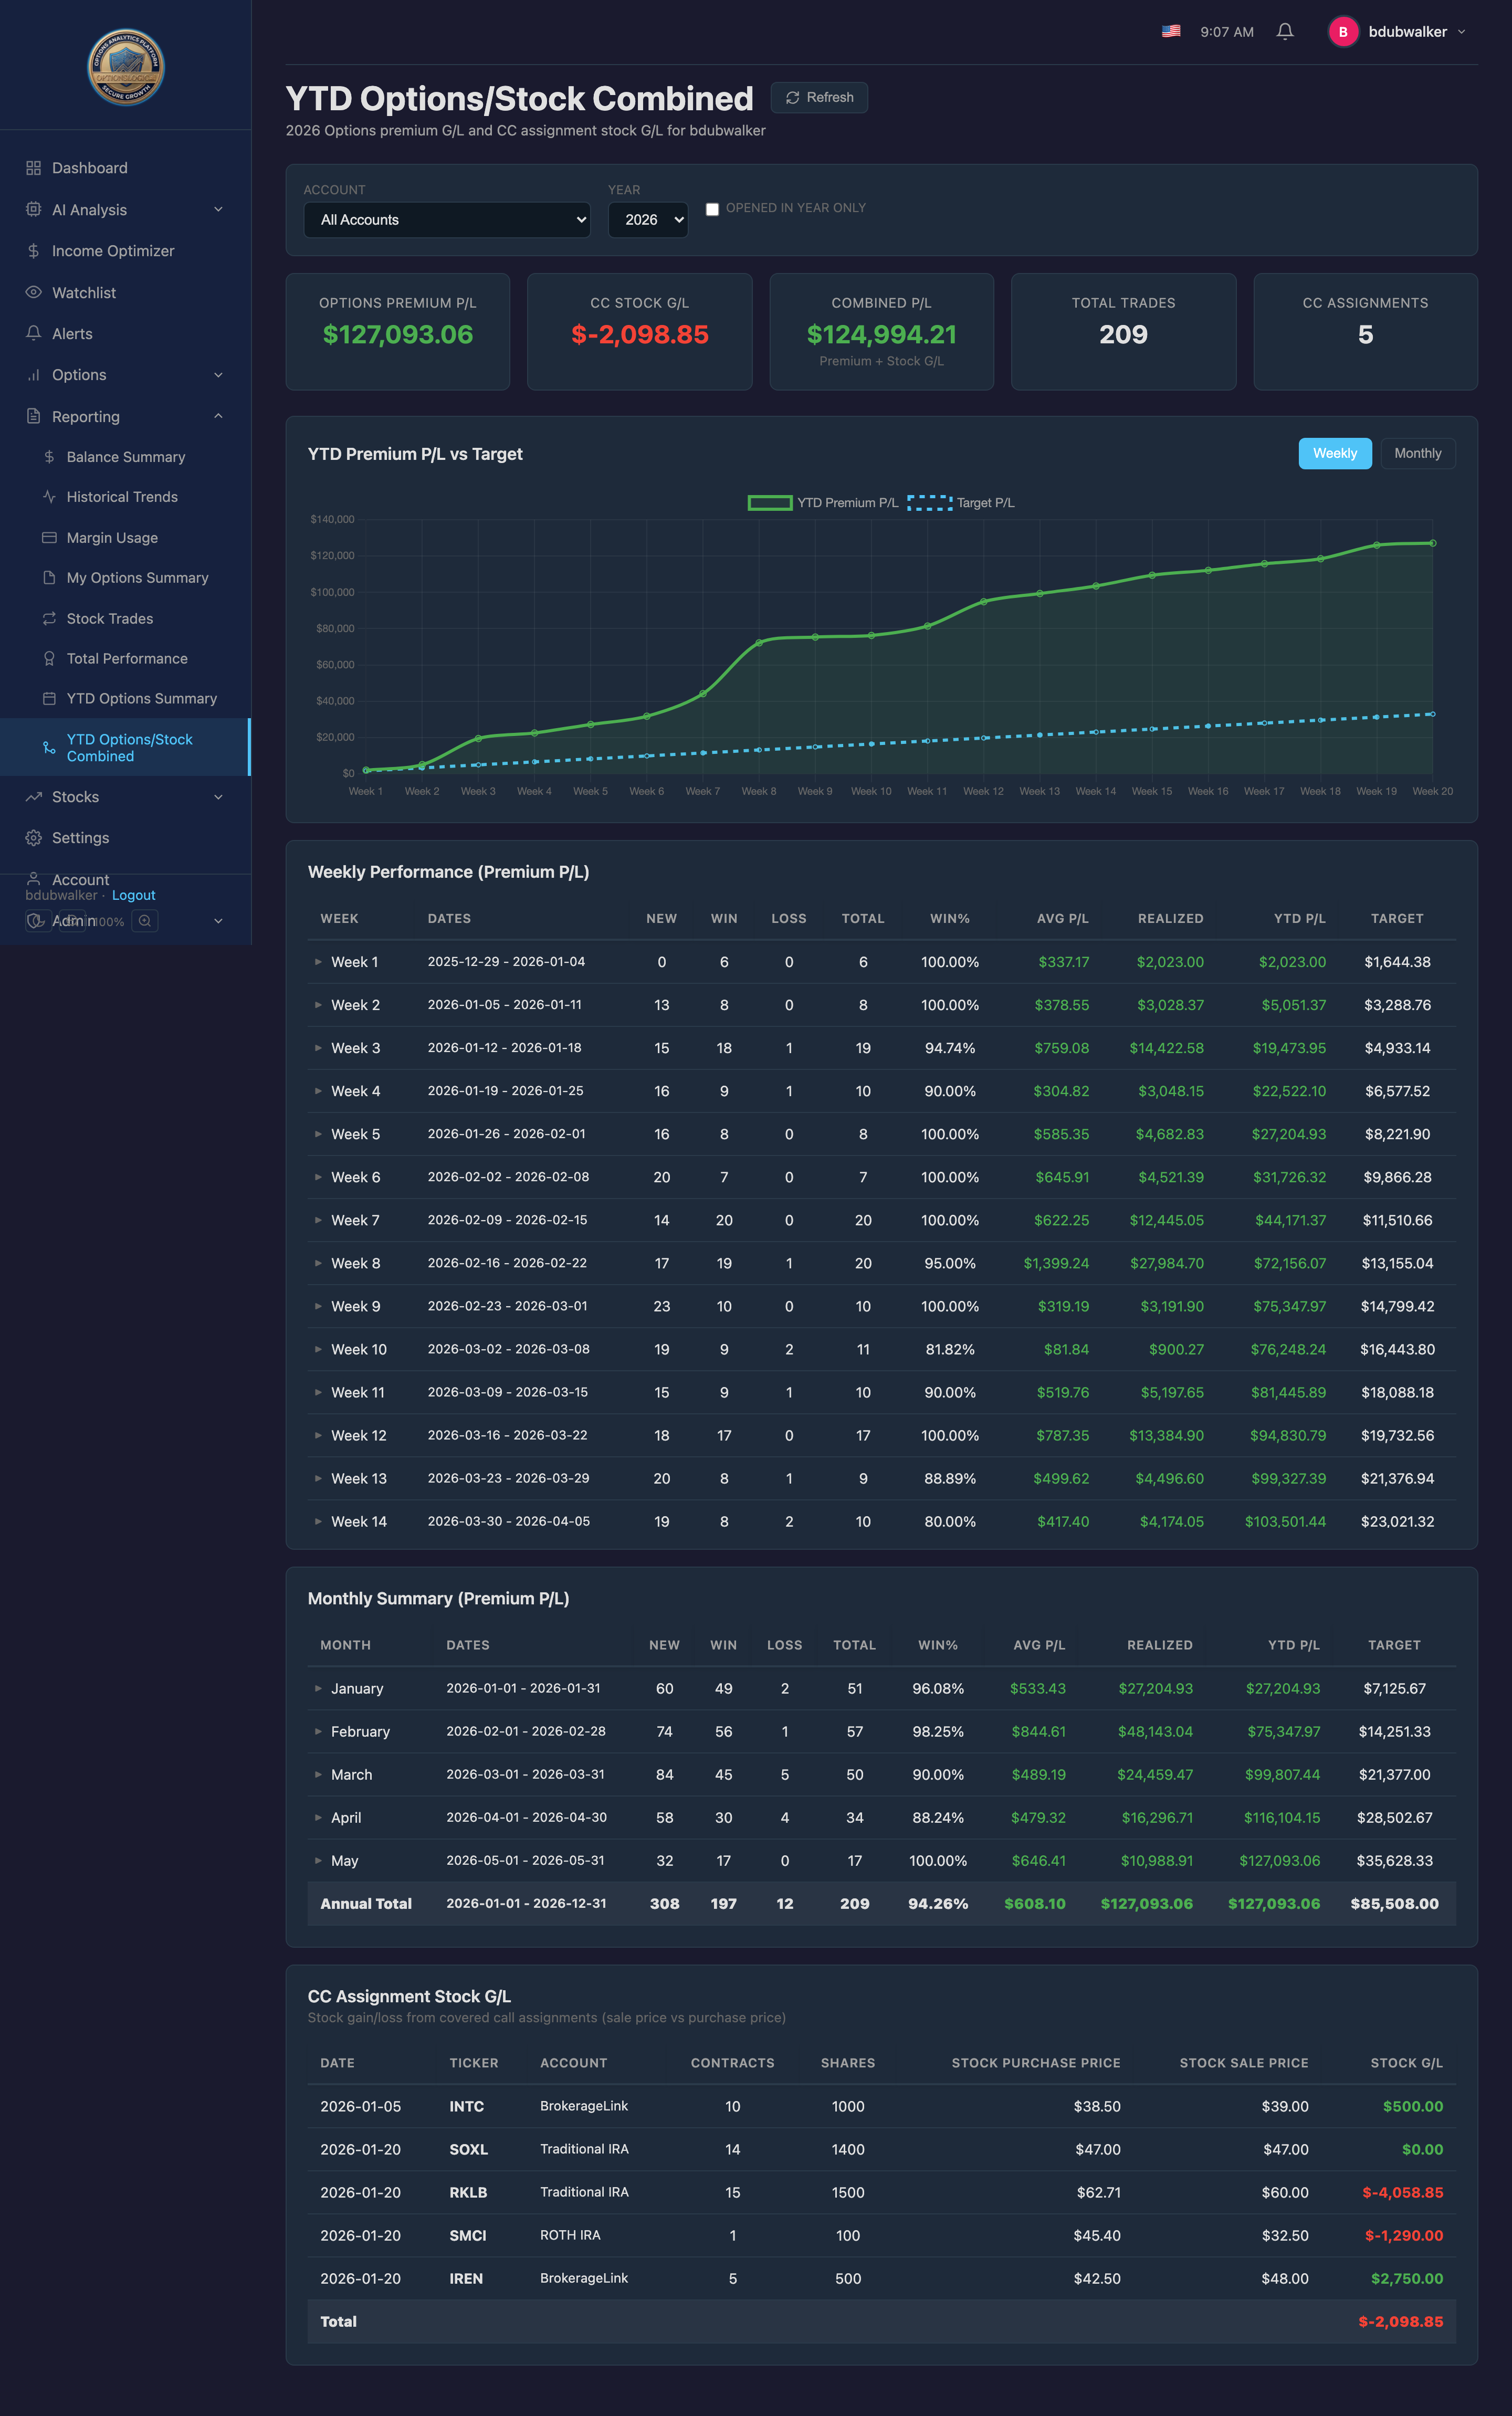
YTD Options/Stock Combined
Combines options premium P&L with covered call assignment stock gains/losses. This gives you the complete return picture for CC strategies where premium income and stock appreciation both matter.
- Options premium section — same as YTD Options Summary
- CC assignment stock G/L — cost basis vs. assignment strike for assigned shares
- Combined totals — premium + stock gains for true strategy performance
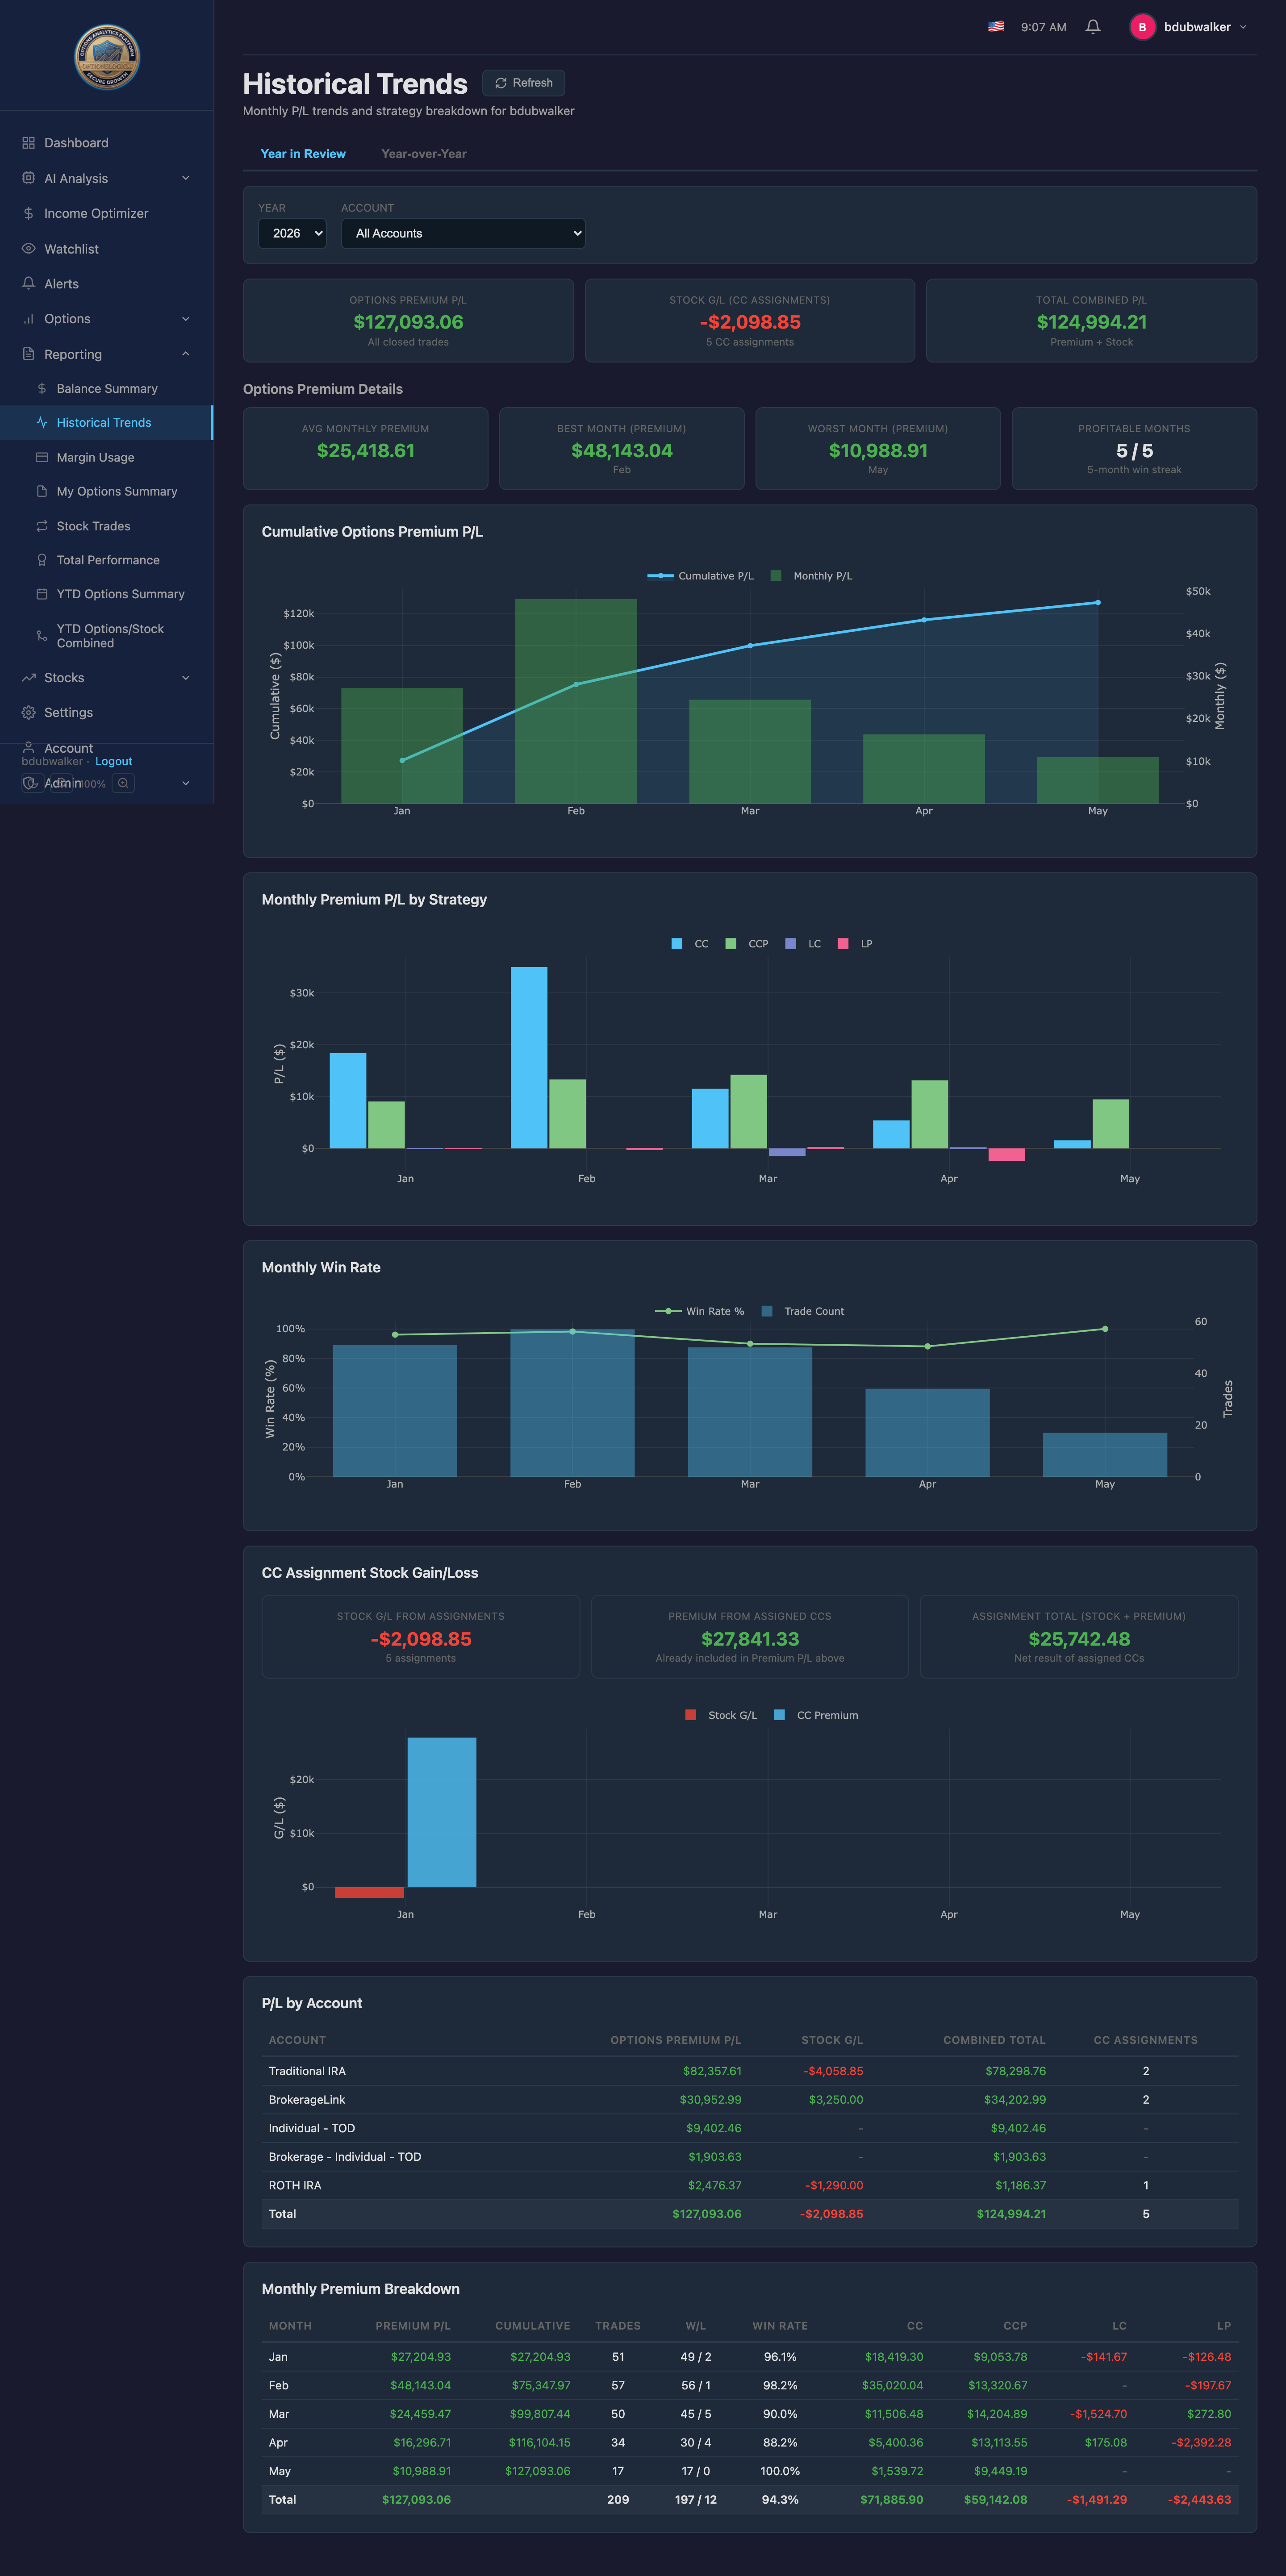
Historical Trends
Analyze your trading performance over time with two views:
Year in Review
- Monthly P&L with cumulative chart
- Strategy breakdown by month
- Win rate trends, best/worst months
- Account-level P&L with clickable drill-down
Year over Year
- Weekly cumulative P&L overlay for 2+ years
- Side-by-side comparison of trading performance across years
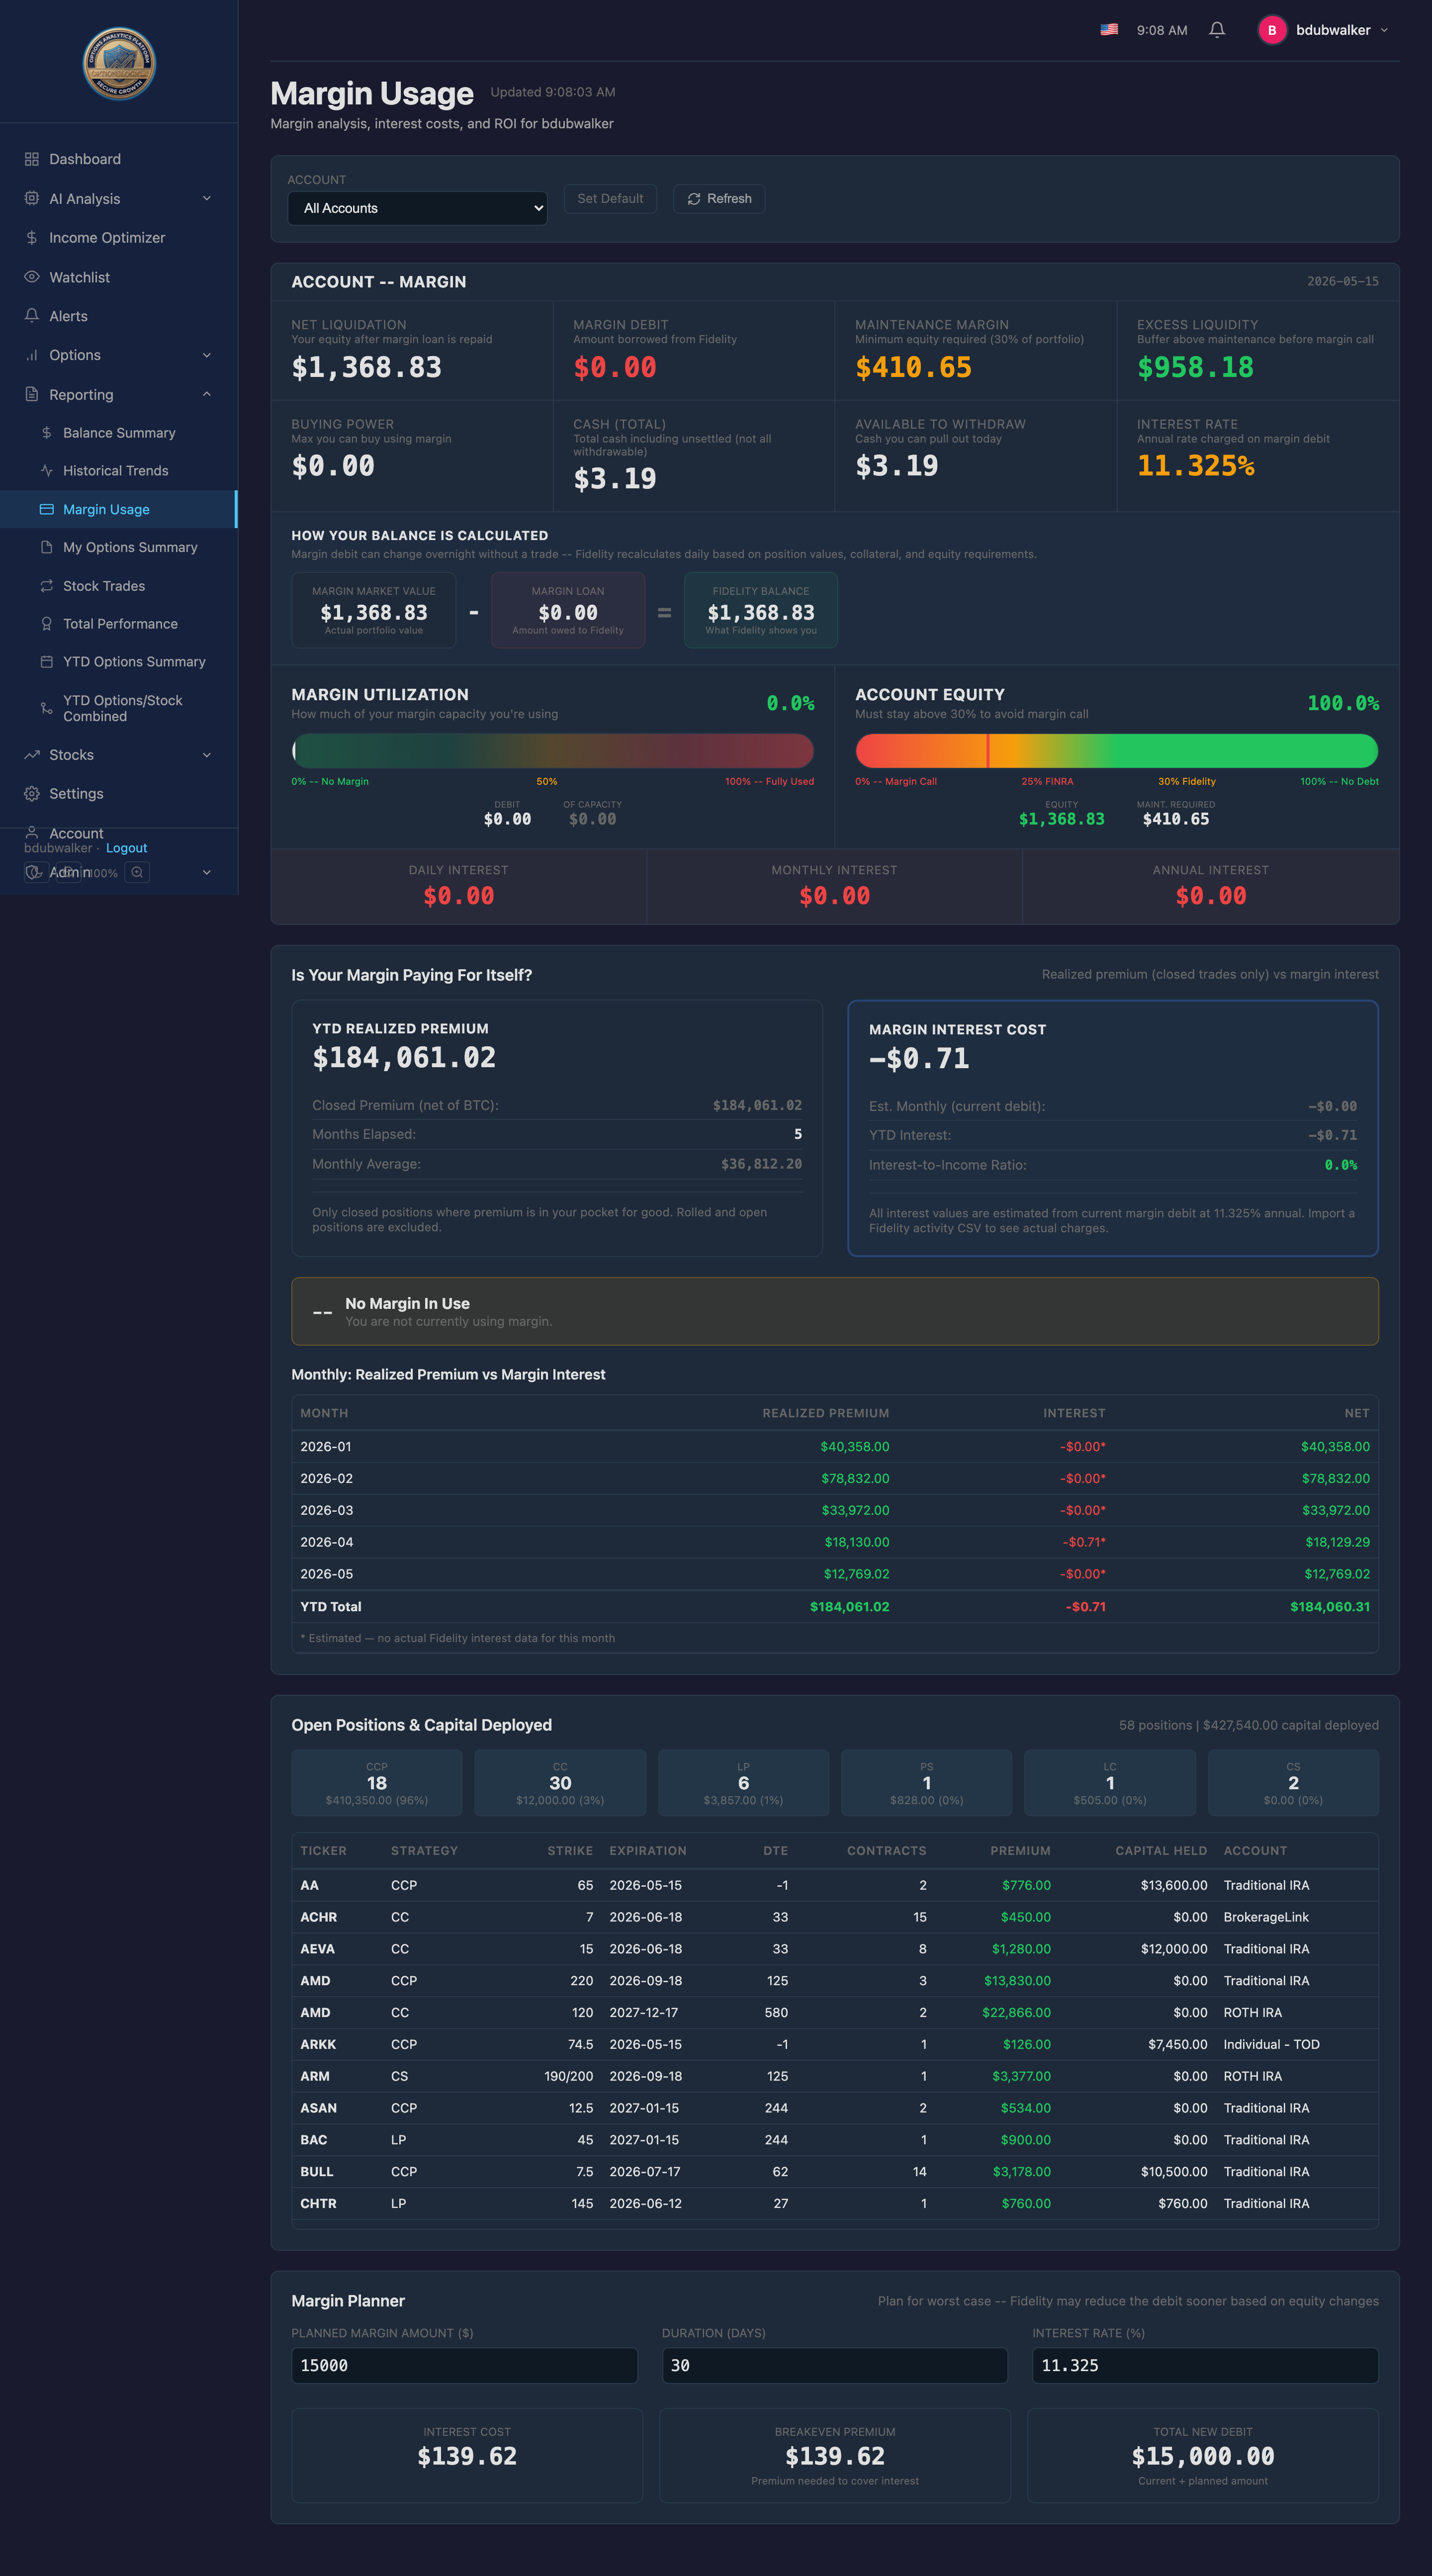
Margin Usage
Understand your margin efficiency and whether your premium income exceeds your borrowing costs.
- Account panel — total value, margin debit, equity %, cash, buying power
- Utilization gauges — color-coded health indicators
- Interest costs — daily, monthly, and annual estimates vs. actuals from Fidelity
- YTD ROI — premium income vs. interest paid, with an interest-to-income ratio
- Monthly comparison — bar chart of premium realized vs. margin interest charged
- Capital deployed — breakdown by strategy and position
- Balance history — trend chart of margin debit and total value over time
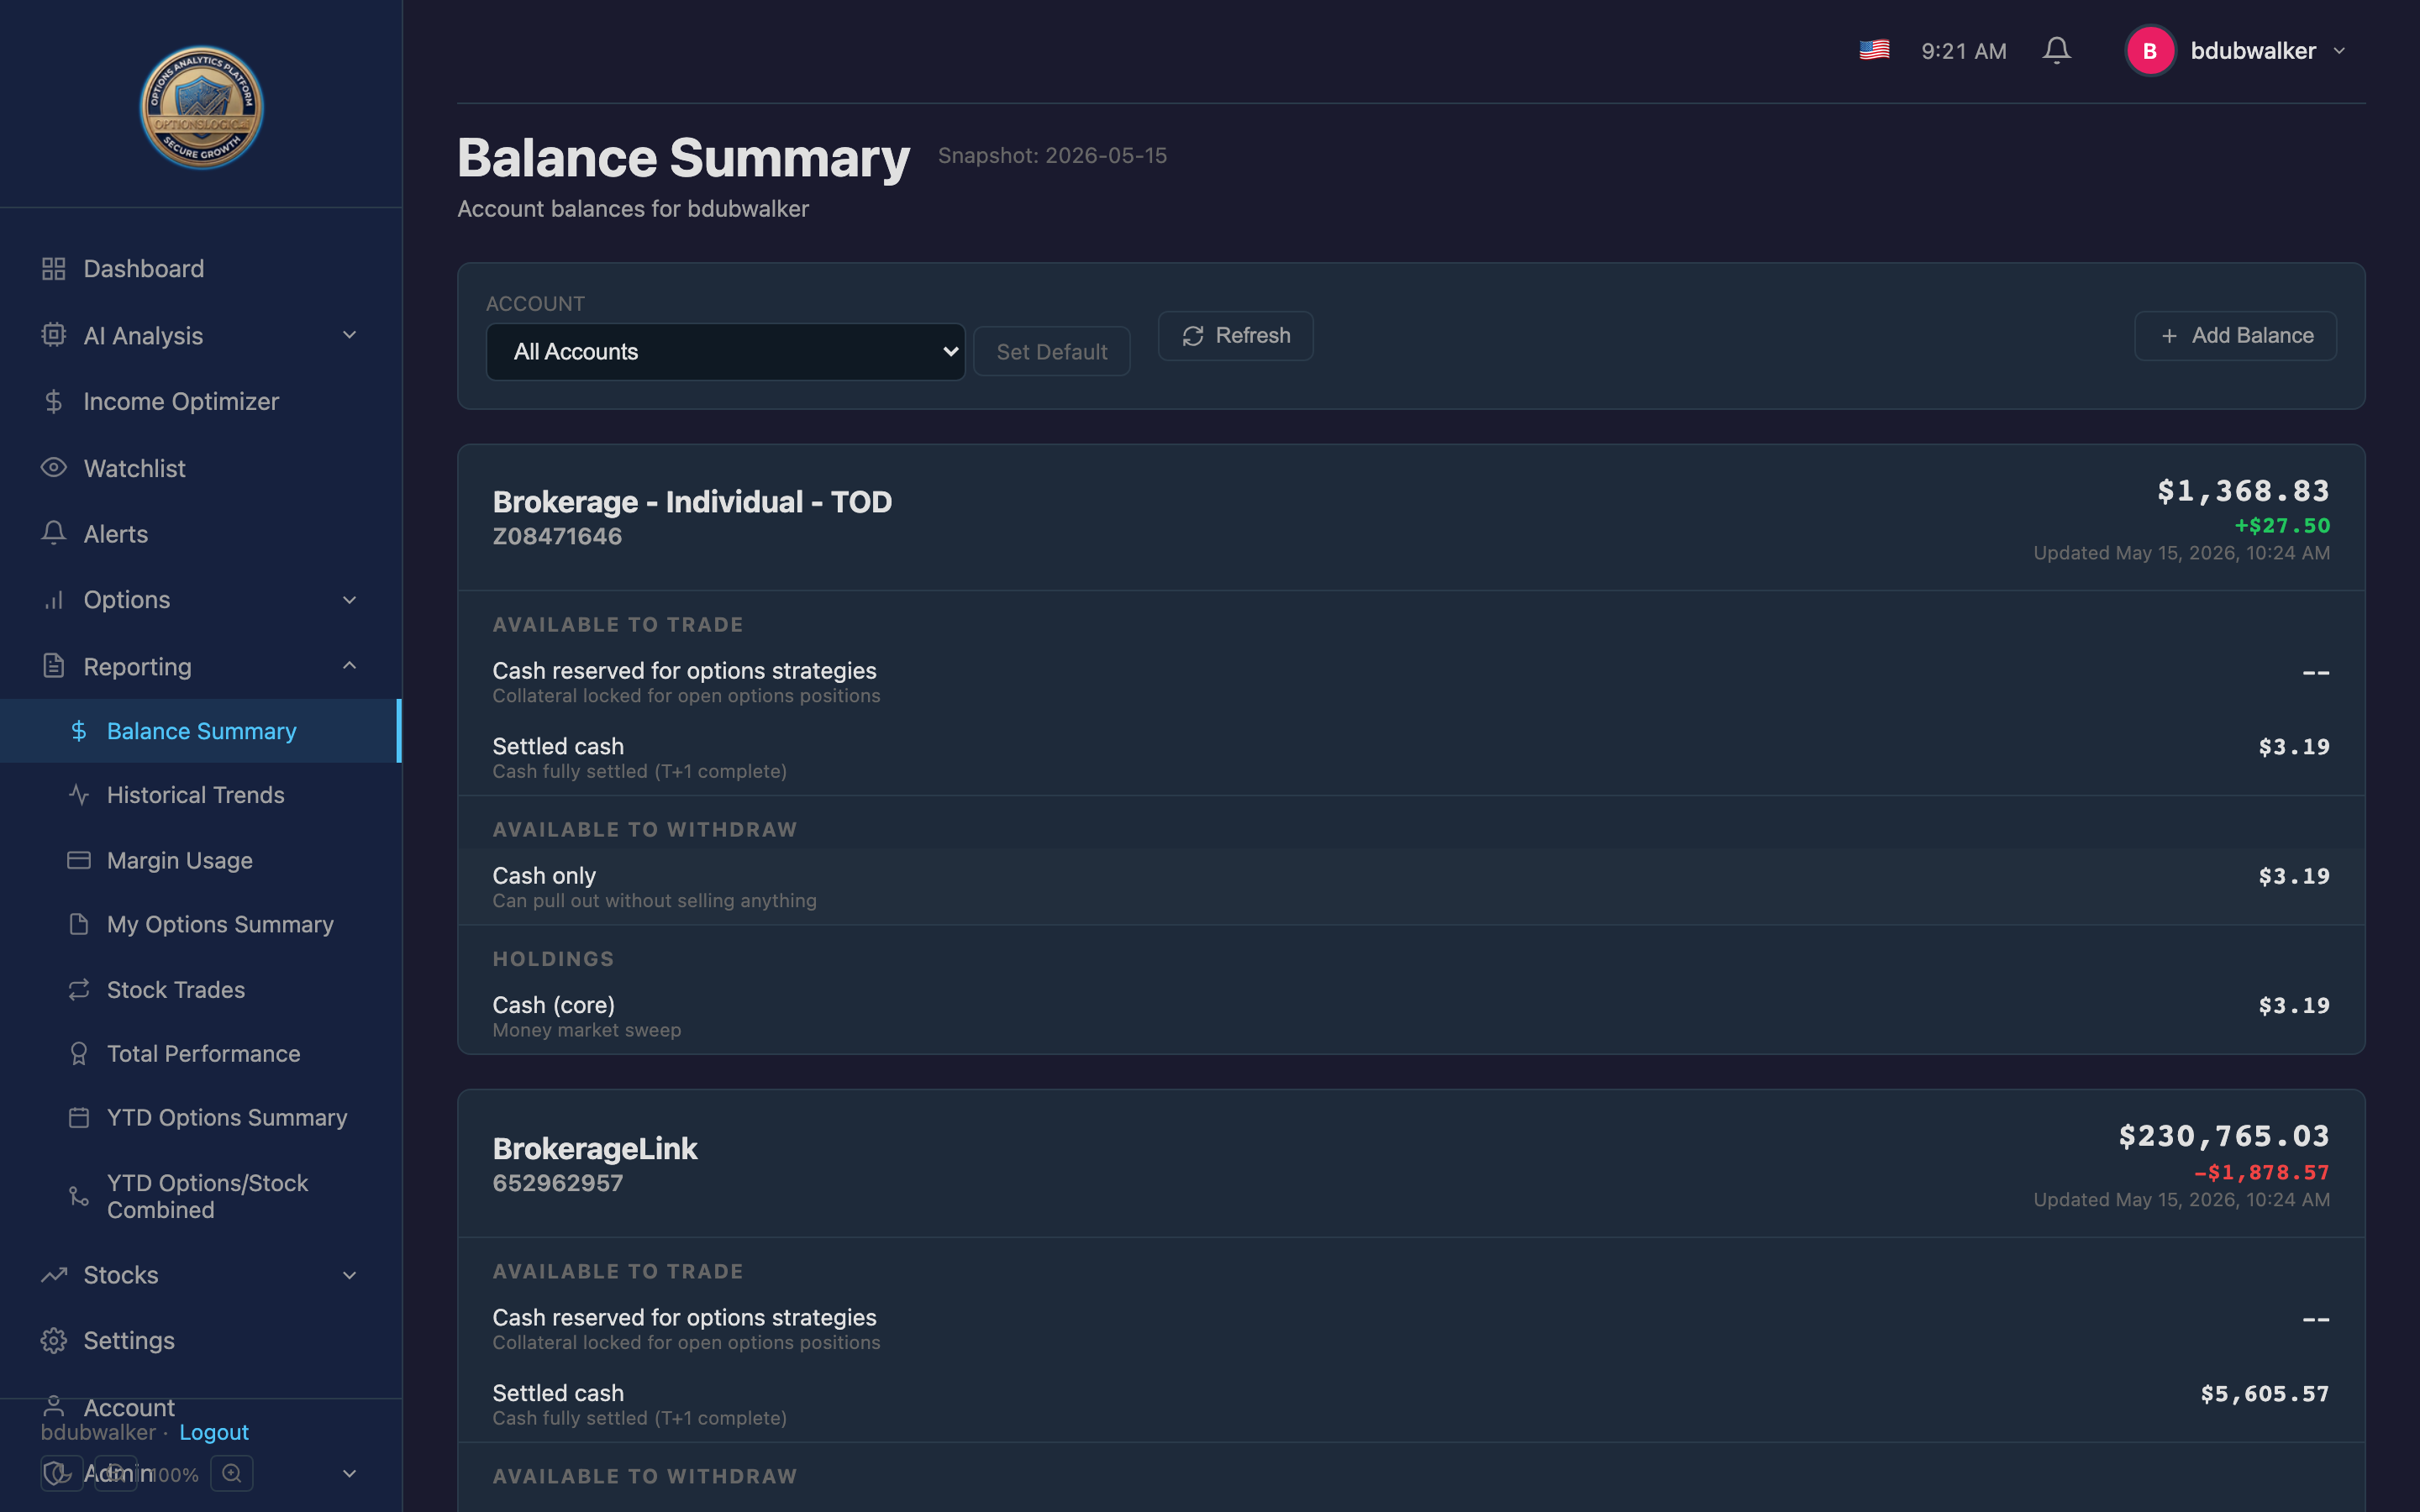
Balance Summary
A quick snapshot of account health across all your brokerage accounts.
- Per-account sections — available to trade, available to withdraw, margin status, holdings
- Open short positions — capital locked per account by strategy
- Manual balance entry — add non-Fidelity accounts (Robinhood, Schwab, etc.)
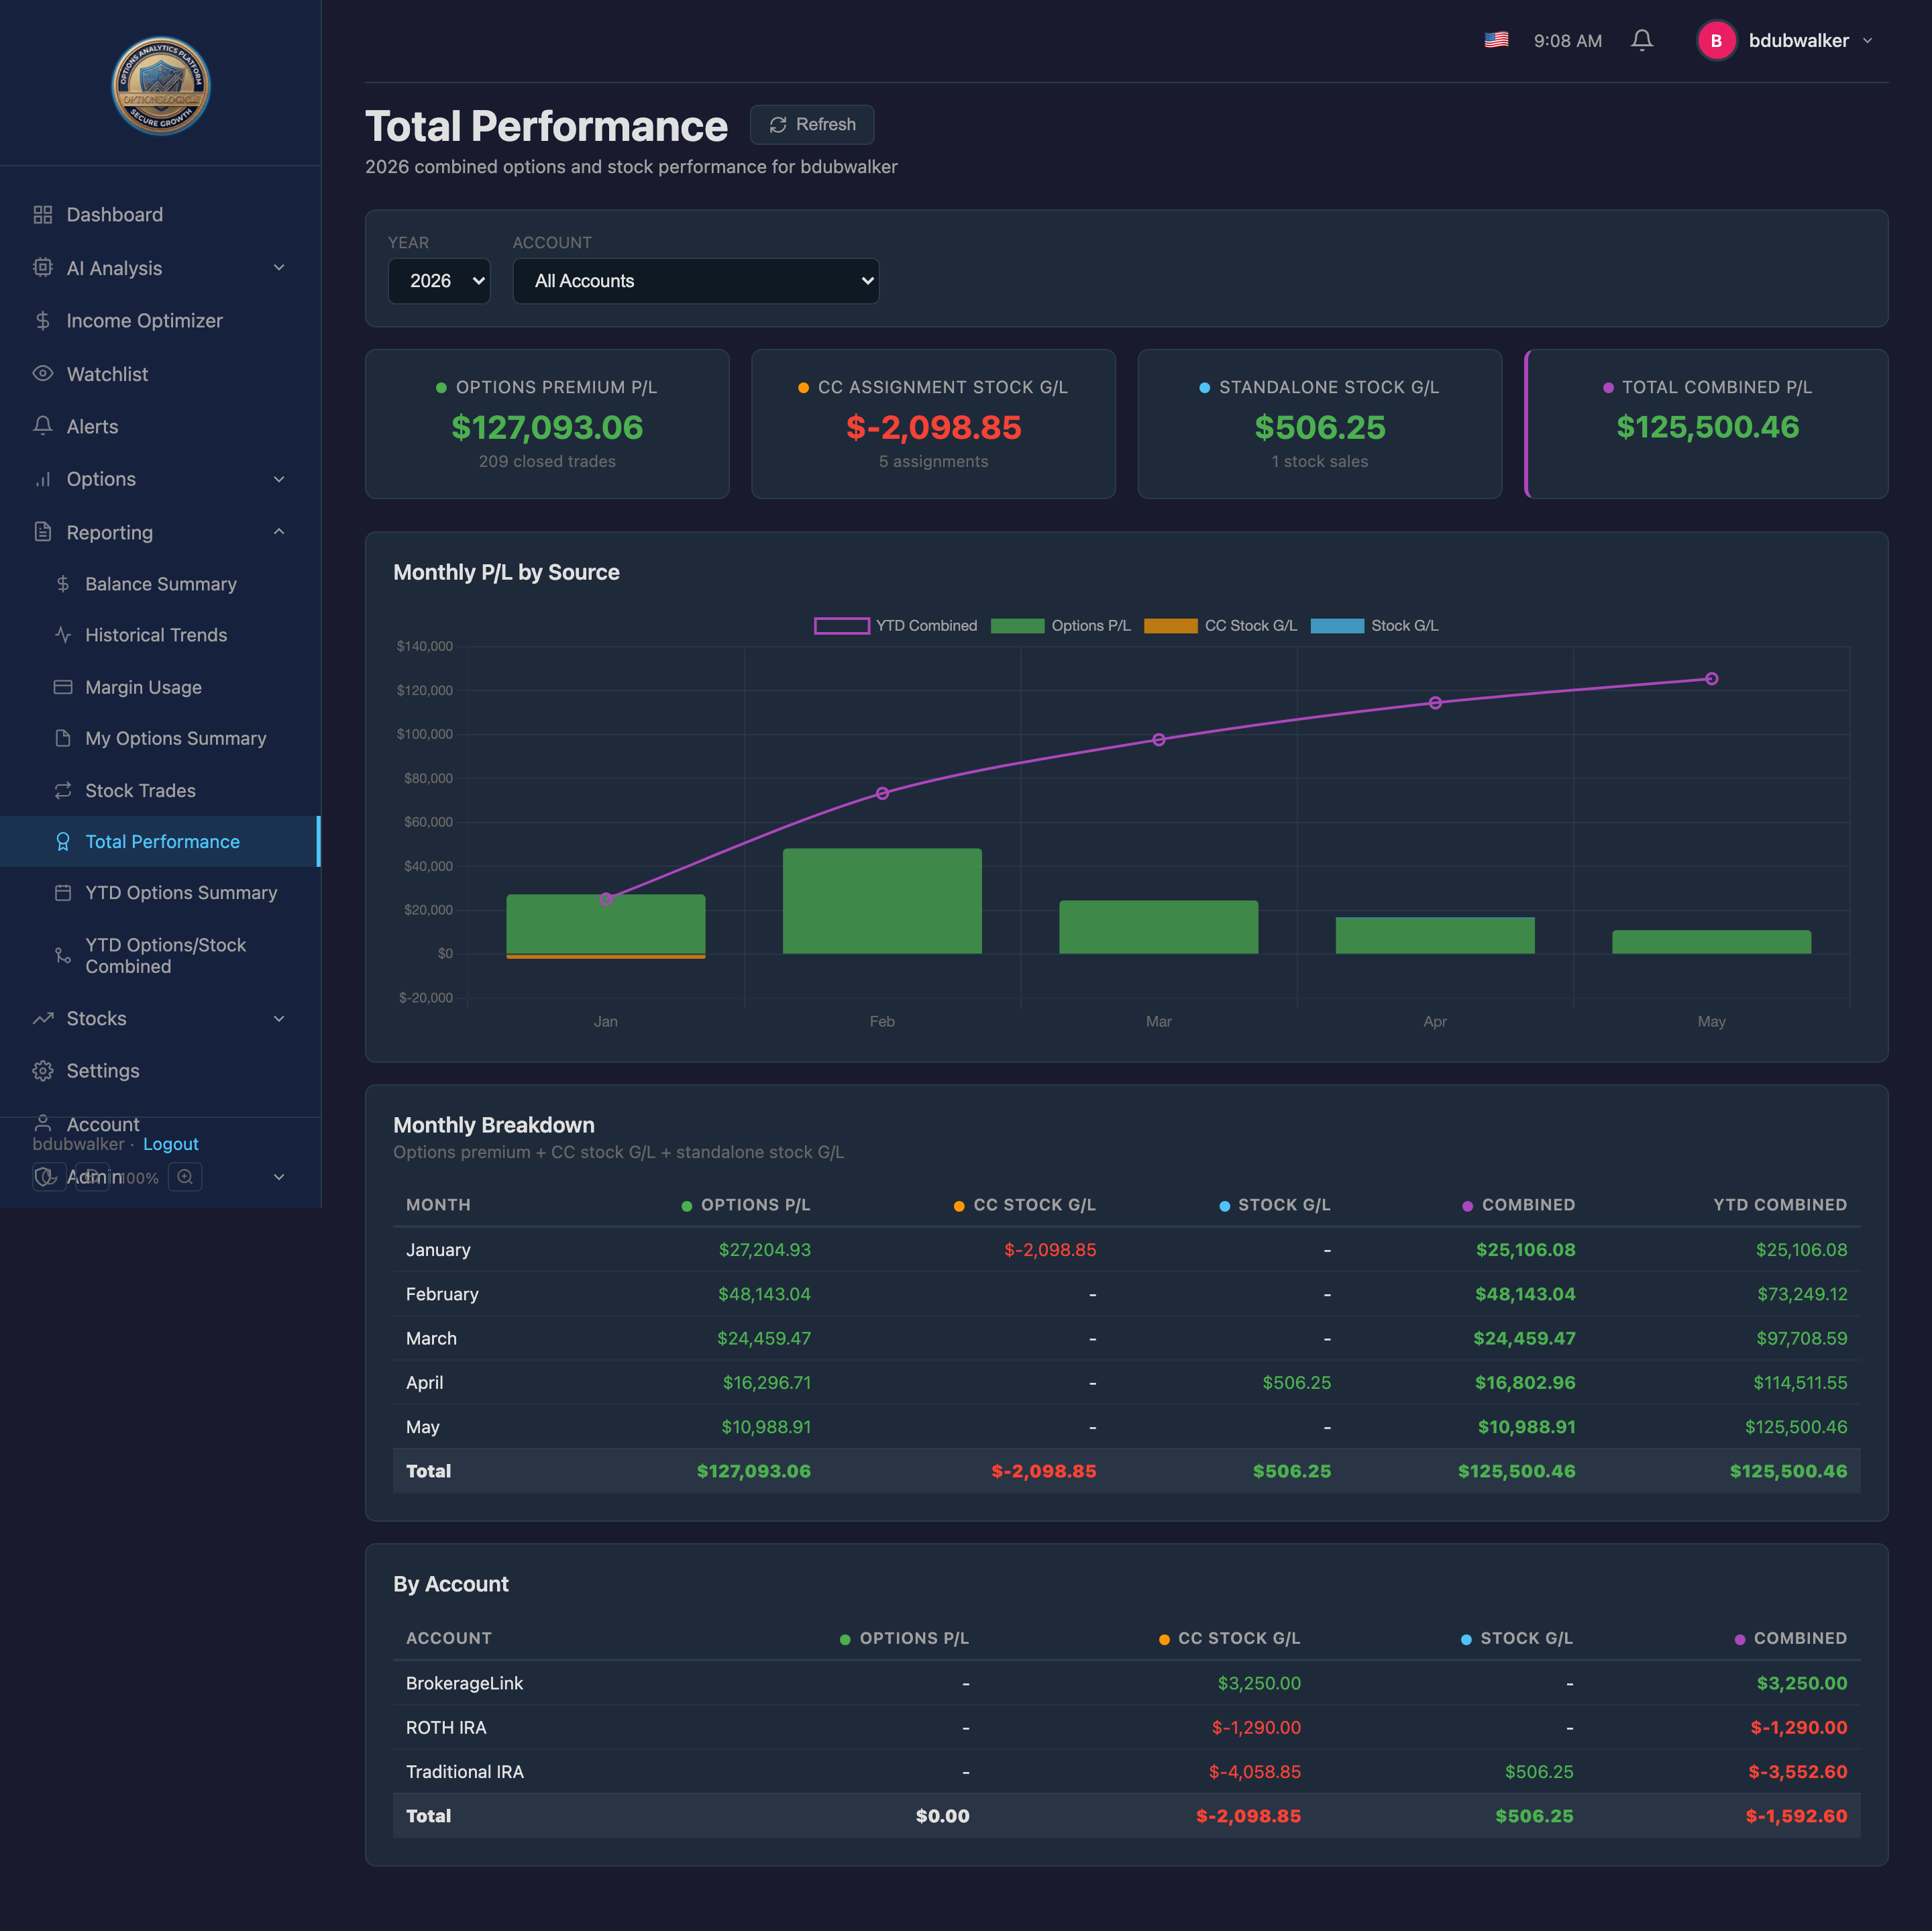
Total Performance
The single unified view of all trading activity. Combines options premium P&L, covered call assignment stock G/L, and standalone stock trading P&L into one comprehensive report.
Answers the question: "How much money did I make across all strategies combined?"
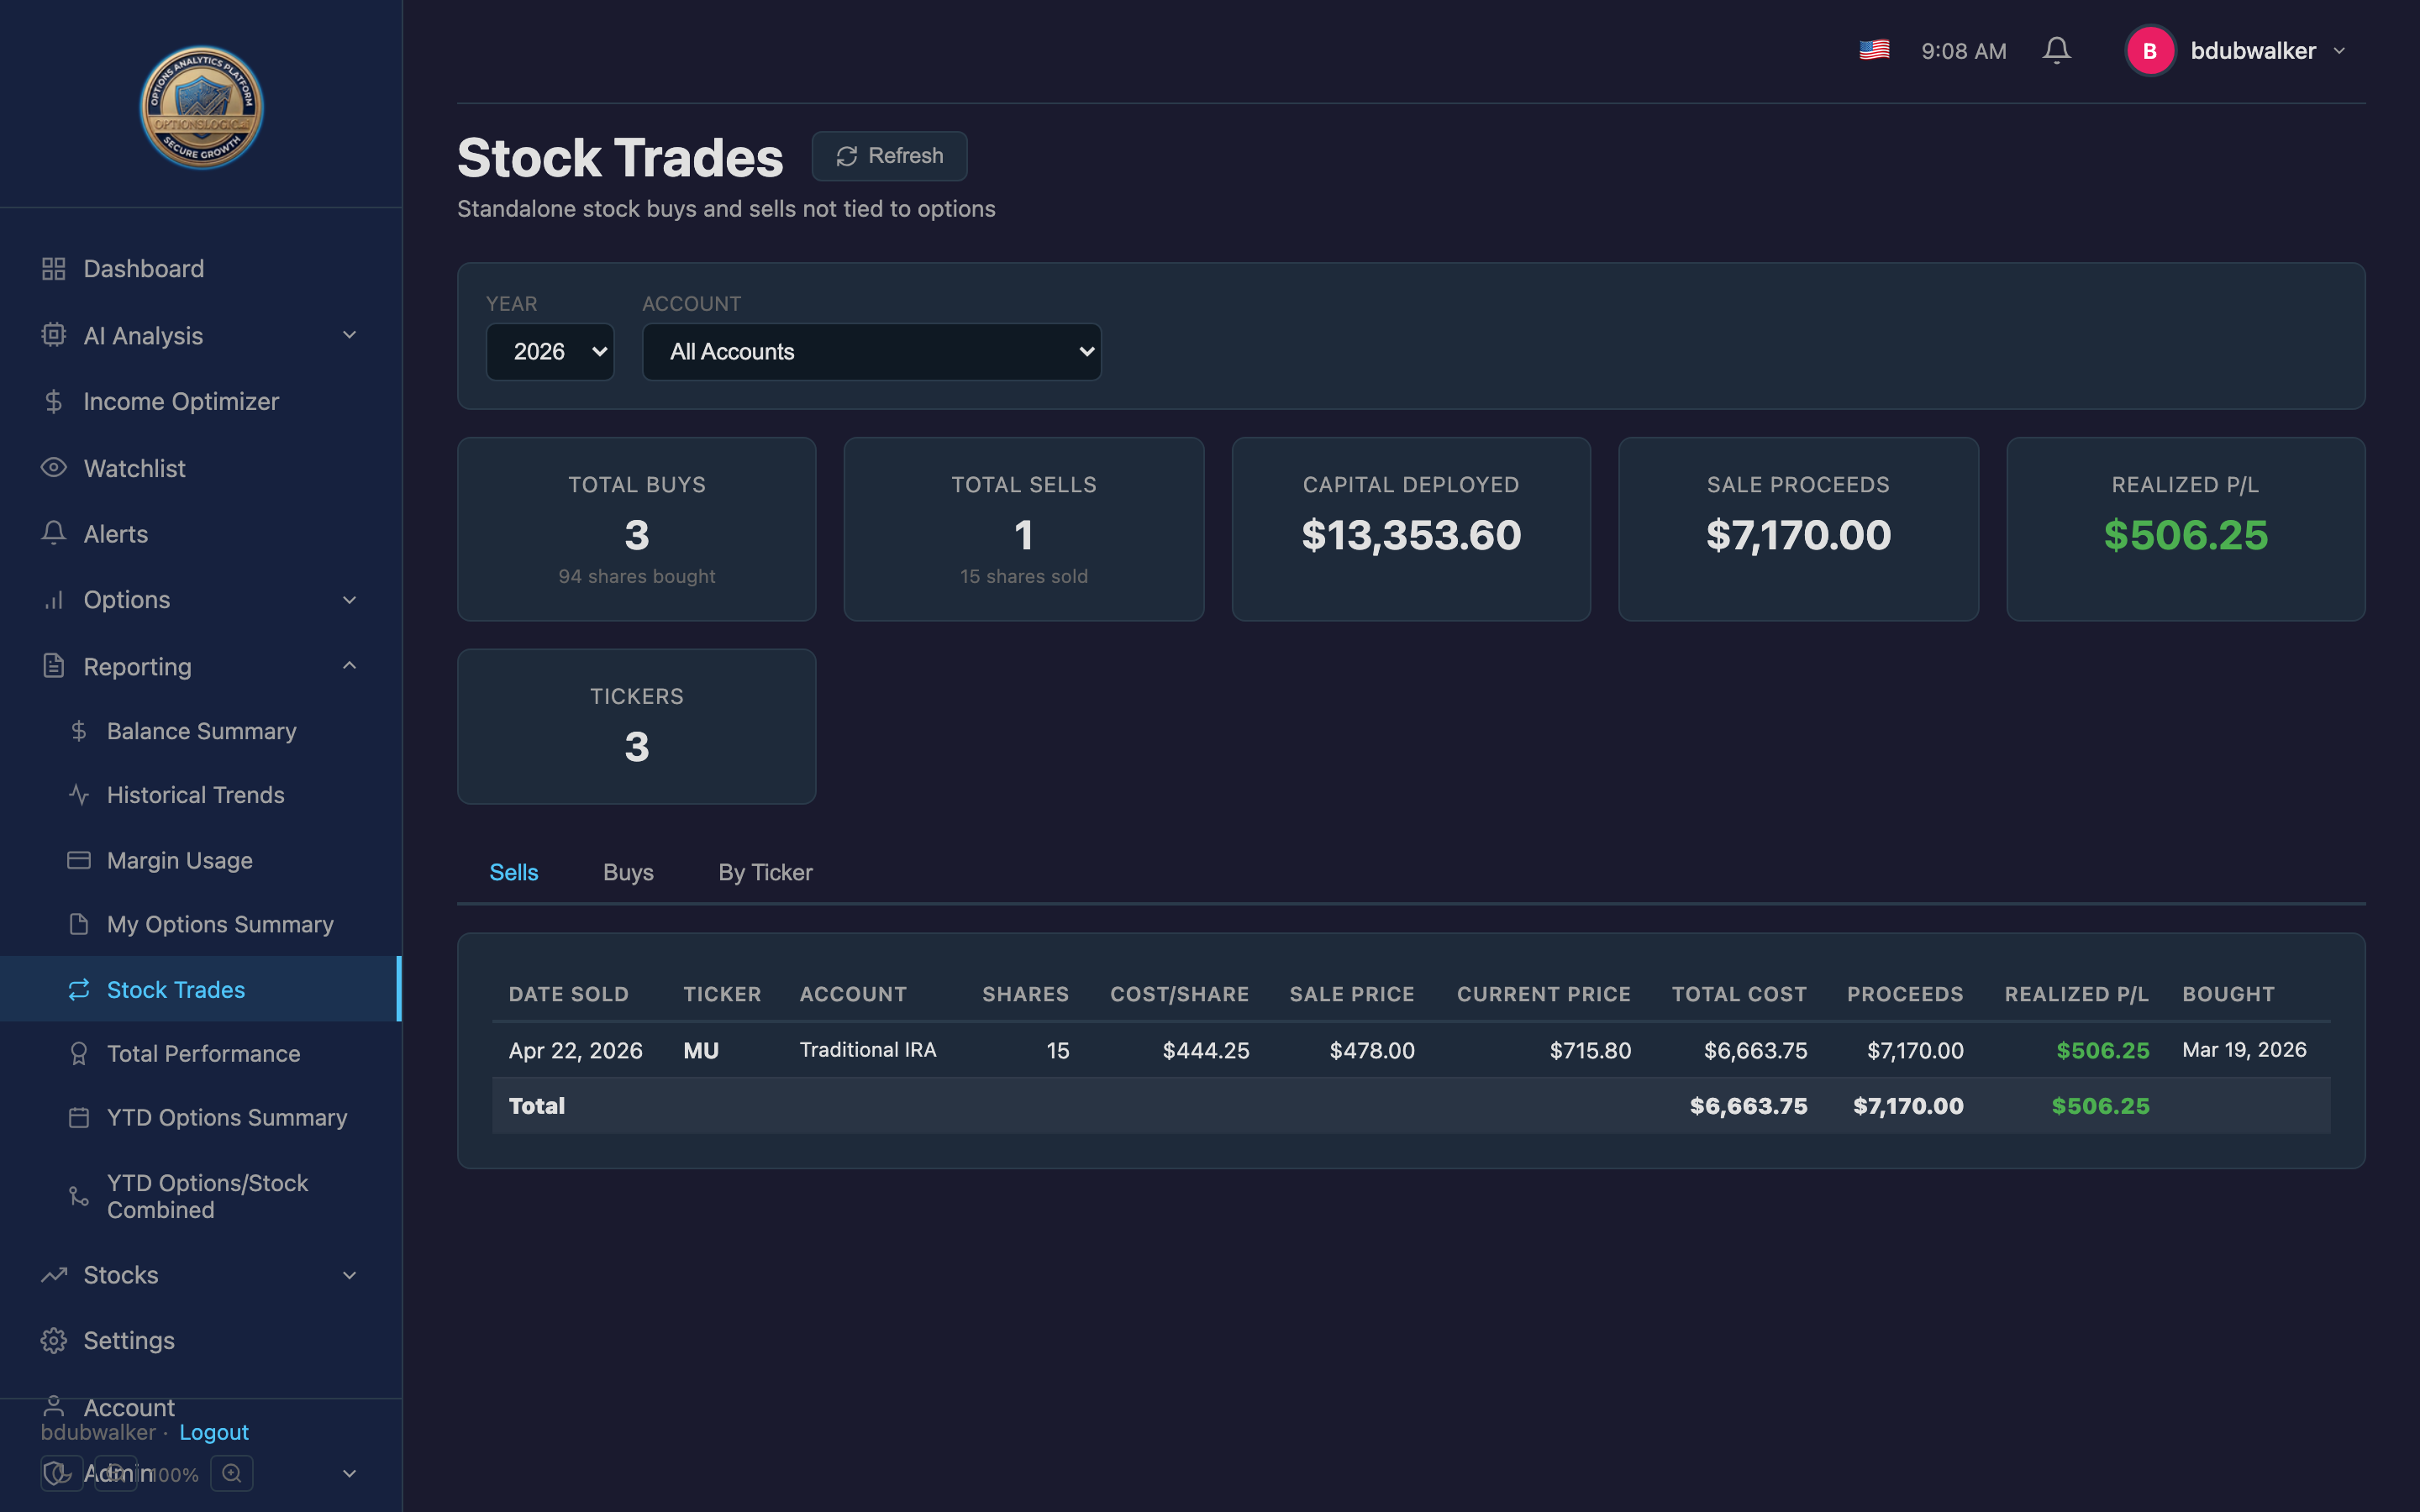
Stock Trades
Tracks standalone stock transactions (buys, sells, and by-ticker summaries) separate from your options activity.
- Sells tab — completed sales with realized P&L (cost basis vs. sale price)
- Buys tab — purchases with unrealized P&L (current price vs. cost basis)
- By Ticker tab — aggregated view showing buys, sells, remaining shares, and total realized/unrealized gains per symbol
Available for Covered Calls
Shows which of your stock holdings have 100+ shares and are eligible for writing covered calls. This helps you identify income opportunities on shares you already own.
- Lists all stock positions with 100+ shares per lot
- Shows current price, cost basis, and unrealized P&L
- Highlights positions not currently paired with a covered call

Stock Positions
A comprehensive view of all your stock holdings across accounts with cost basis, current price, unrealized P&L, and P&L percentage per lot.

Settings & Preferences
Configure your account preferences, broker credentials, and automated data downloads.
Key Settings
- Credential Vault — securely store Fidelity credentials for automated CSV downloads. Credentials are encrypted with your vault passphrase.
- Download Scheduling — toggle automatic weekday downloads of Fidelity position and balance data.
- Remember Passphrase — set a TTL (30 min to 8 hours) for how long your vault passphrase stays cached.
- Theme — switch between dark and light mode.
- Zoom — adjust the UI zoom level for your display.

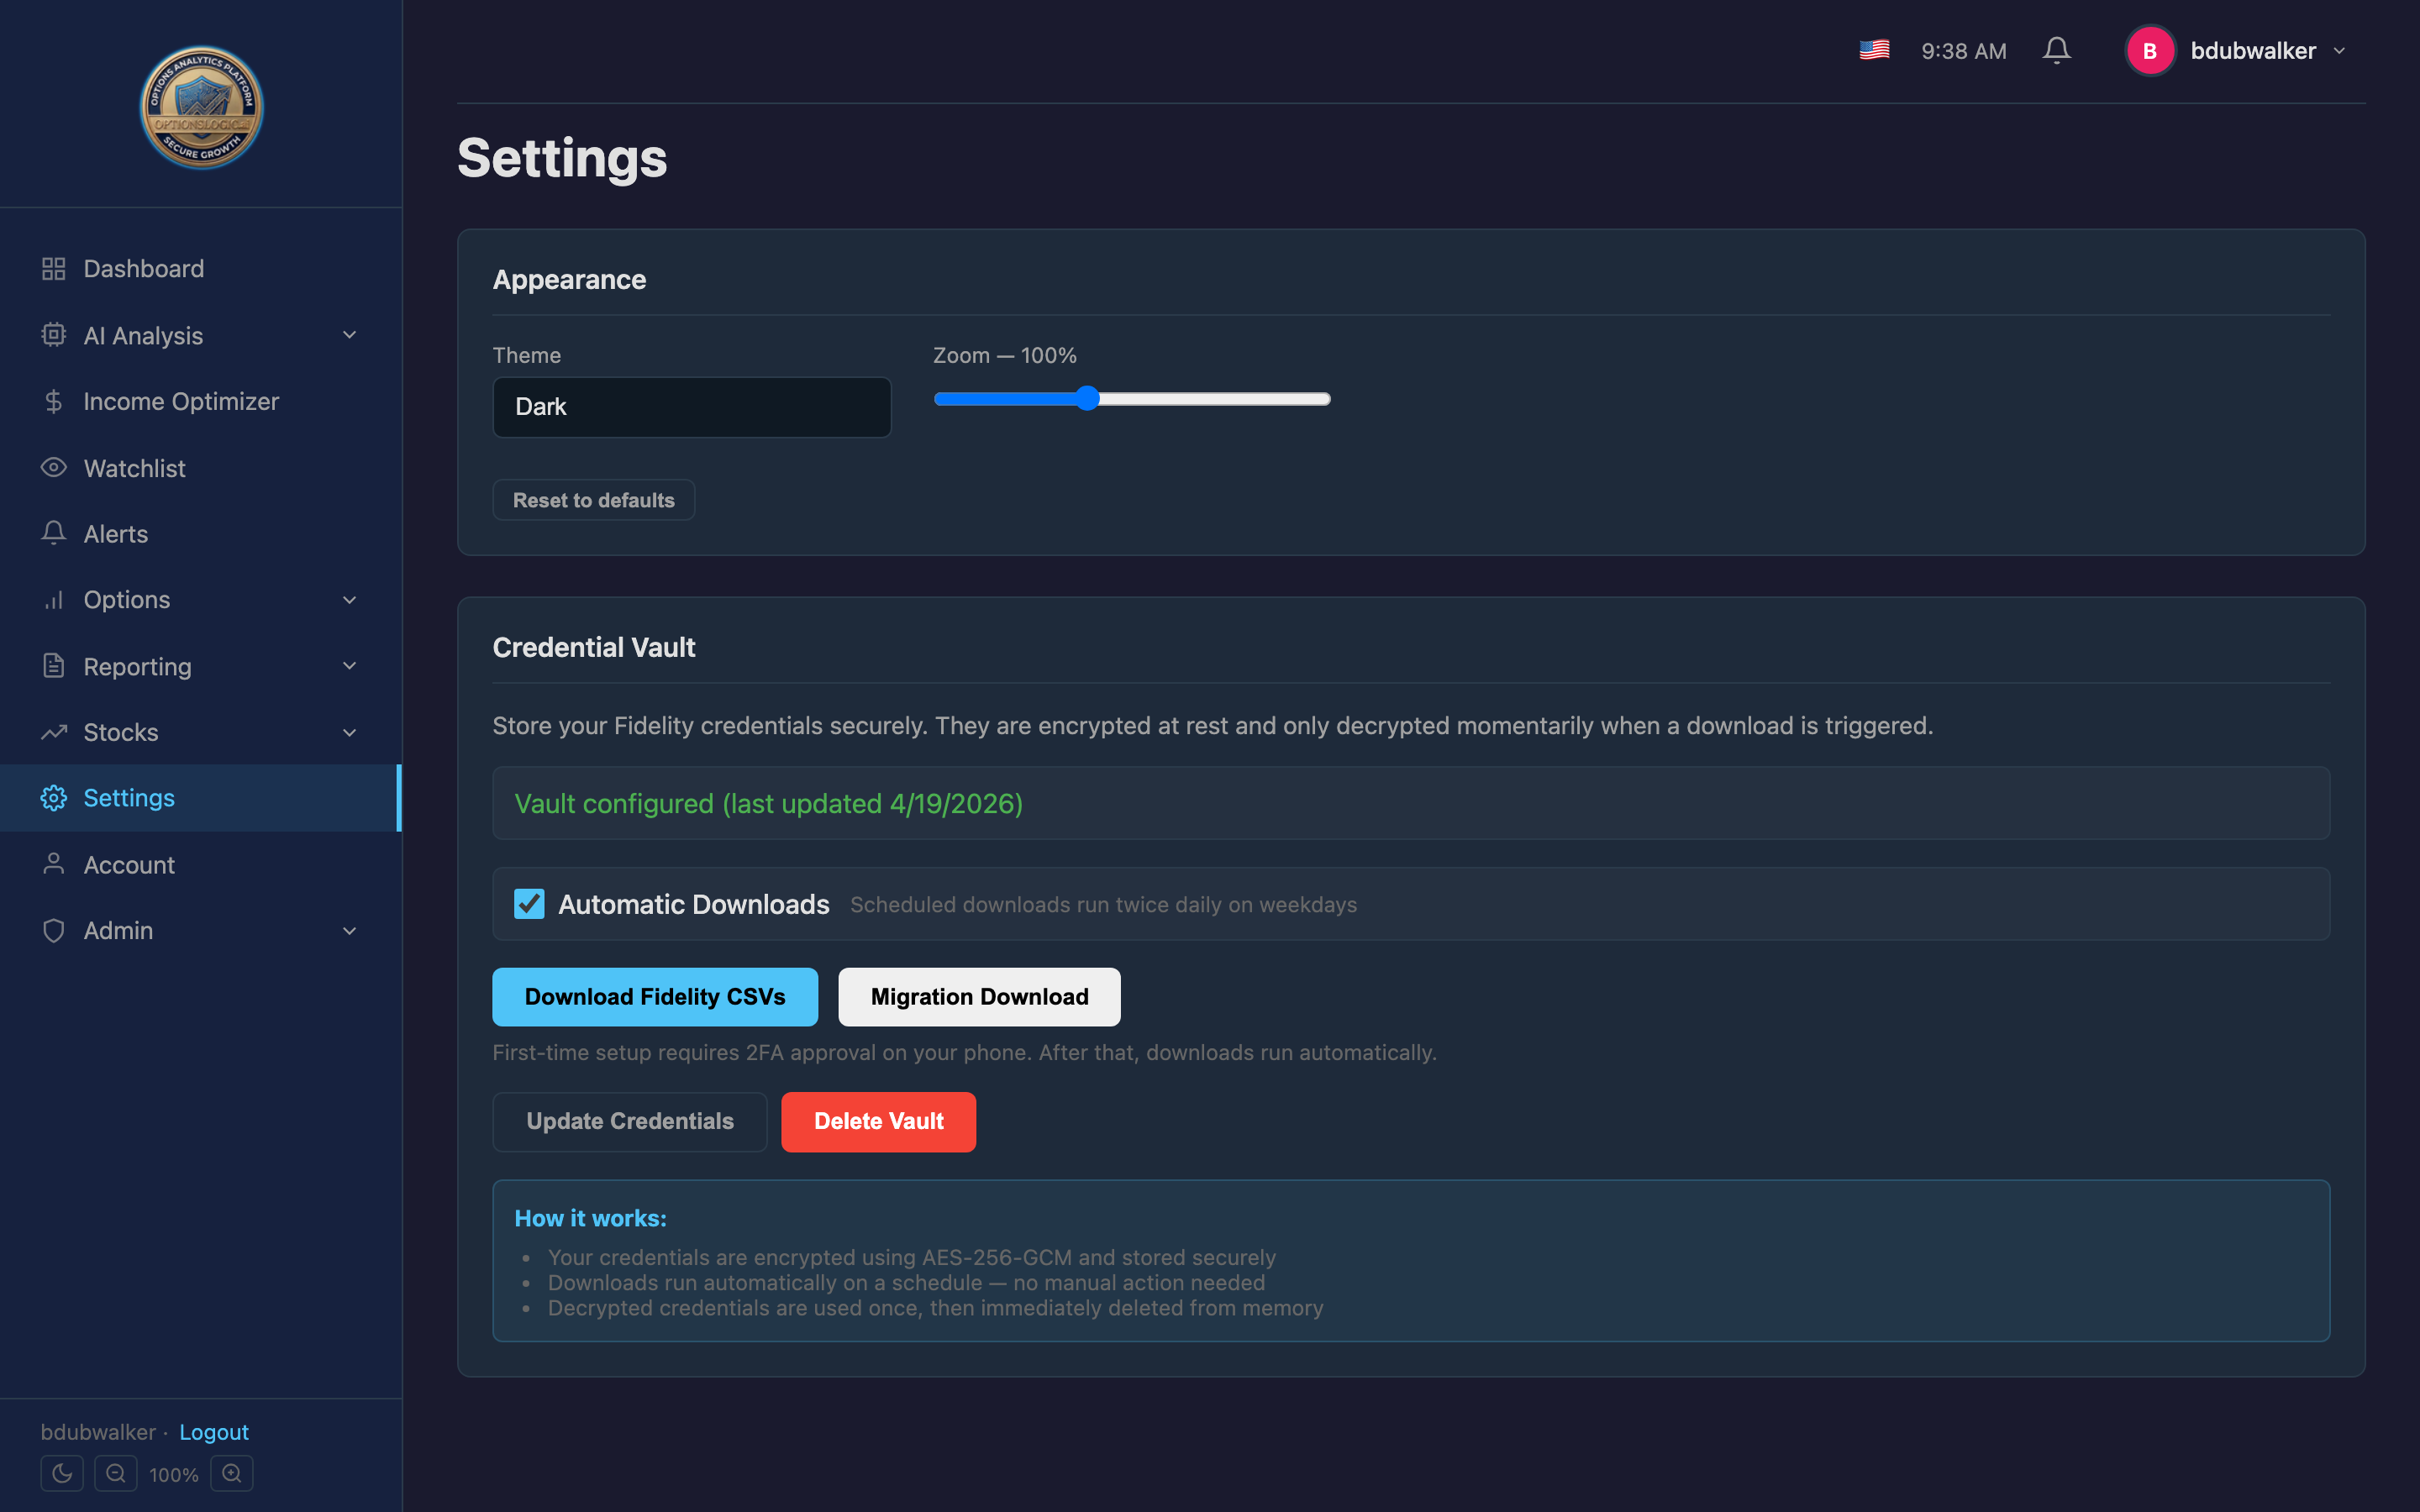
How To: Set Up Credential Vault
The Credential Vault securely stores your Fidelity login credentials using AES-256-GCM encryption so the platform can automatically download your account data.
- Navigate to Settings in the sidebar.
- In the Credential Vault section, you'll see an orange status message if no vault is configured.
- Enter your Fidelity Username and Fidelity Password in the fields provided.
- Click Save Credentials. Your credentials are encrypted and stored securely.
- The status will change to green: "Vault configured" with the date.
- Click Download Fidelity CSVs to trigger your first download. You may need to approve a 2FA push notification on your phone within 2 minutes.
How To: Import Fidelity Data
There are three ways to get your Fidelity data into OptionsLogic.AI PRISM for analysis. All three are accessed from the Trade Actions page.
Method 1: Download Directly (Recommended)
- Go to Options > Trade Actions in the sidebar.
- Click Download Updated Account CSVs (blue button). This requires the Credential Vault to be set up.
- A progress indicator will show download phases: Initializing... Connecting... Downloading... Complete!
- Once complete, the system automatically loads and analyzes the CSV. You'll see summary cards showing what was detected (expired, assigned, rolls, new opens, etc.).
Method 2: Upload a CSV File
- Click or drag-drop a Fidelity History CSV file into the dashed upload area labeled "Click to upload Fidelity History CSV(s)".
- The file is uploaded and analyzed automatically.
Method 3: Browse Server CSVs
- Click Browse Server CSVs (green button).
- Select a Date Folder from the dropdown (most recent first).
- If the date has multiple downloads, select a Time.
- Choose the CSV File and click Load & Analyze.
Reviewing Results
After any import method, summary cards appear showing counts for each category. Click the tabs below to review:
- Expired Worthless — options that expired OTM. Click Close All Expired to process them.
- Assigned — options that were exercised. Click Close All Assigned.
- Closed Early — positions you bought to close. Click Close All.
- Rolls — close + reopen pairs detected as rolls. Click Roll All.
- New Opens — new positions opened since last import. Click Create All.
- Stock Transactions — stock buys and sells. Click Import All.
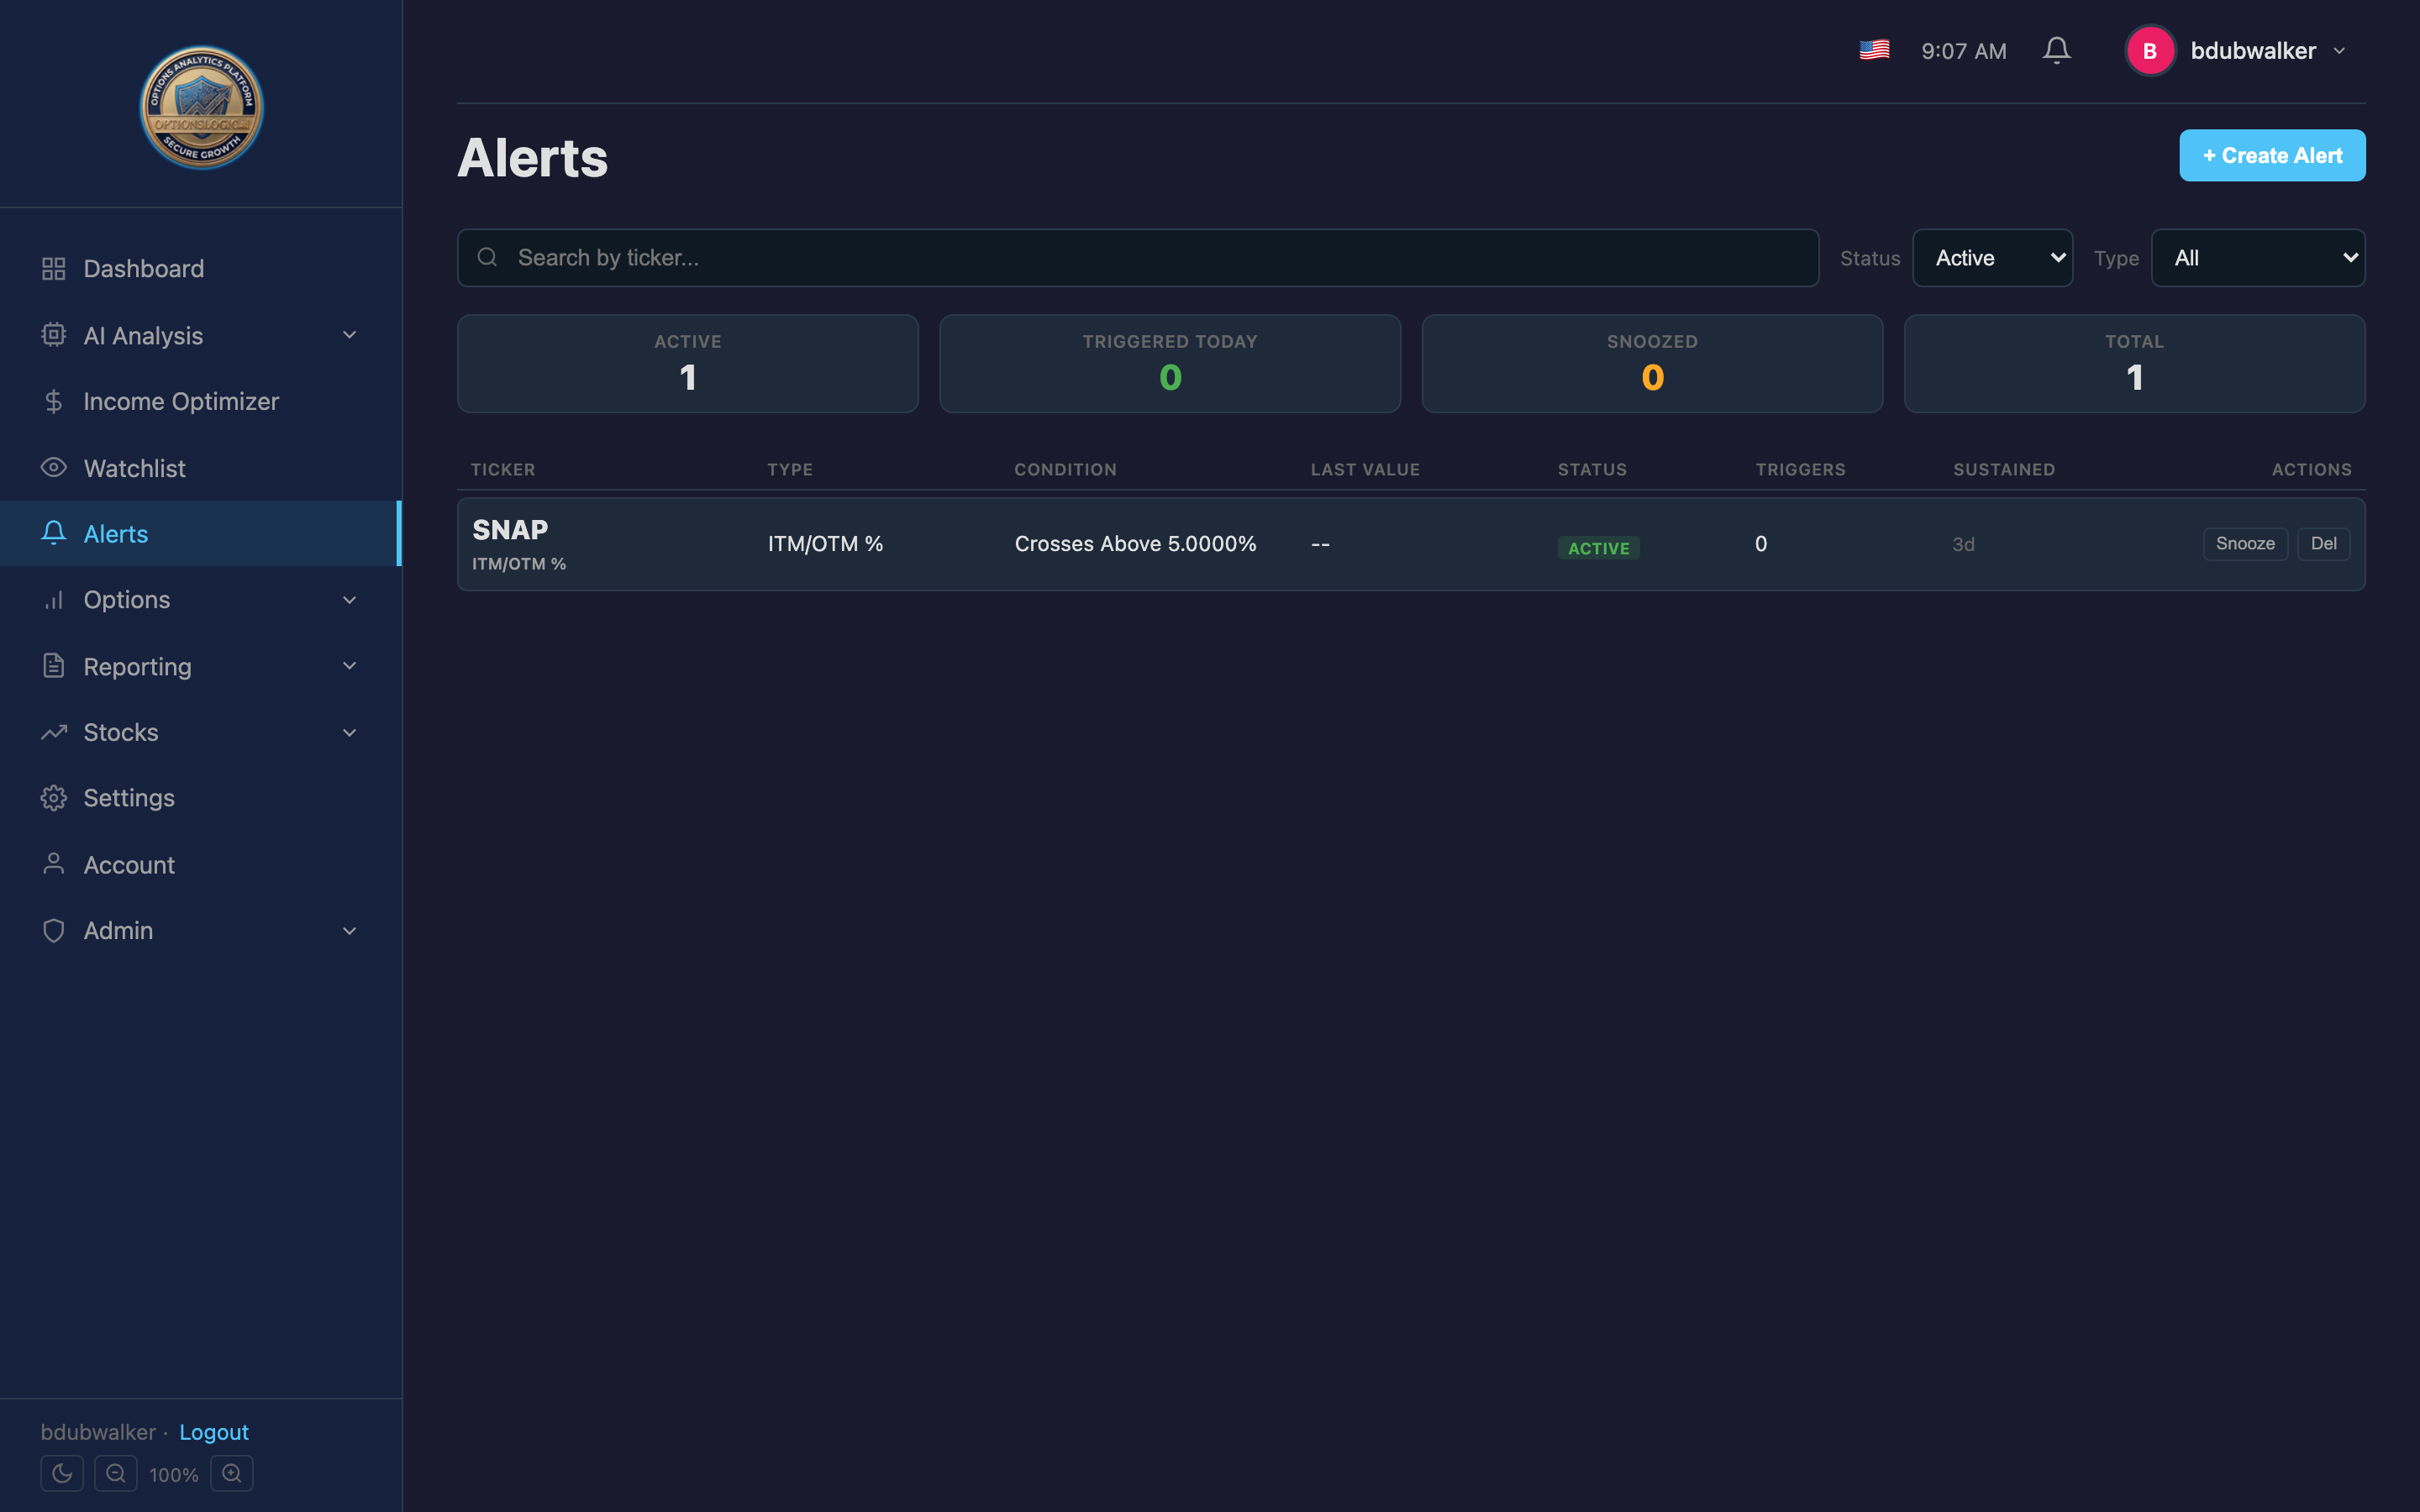
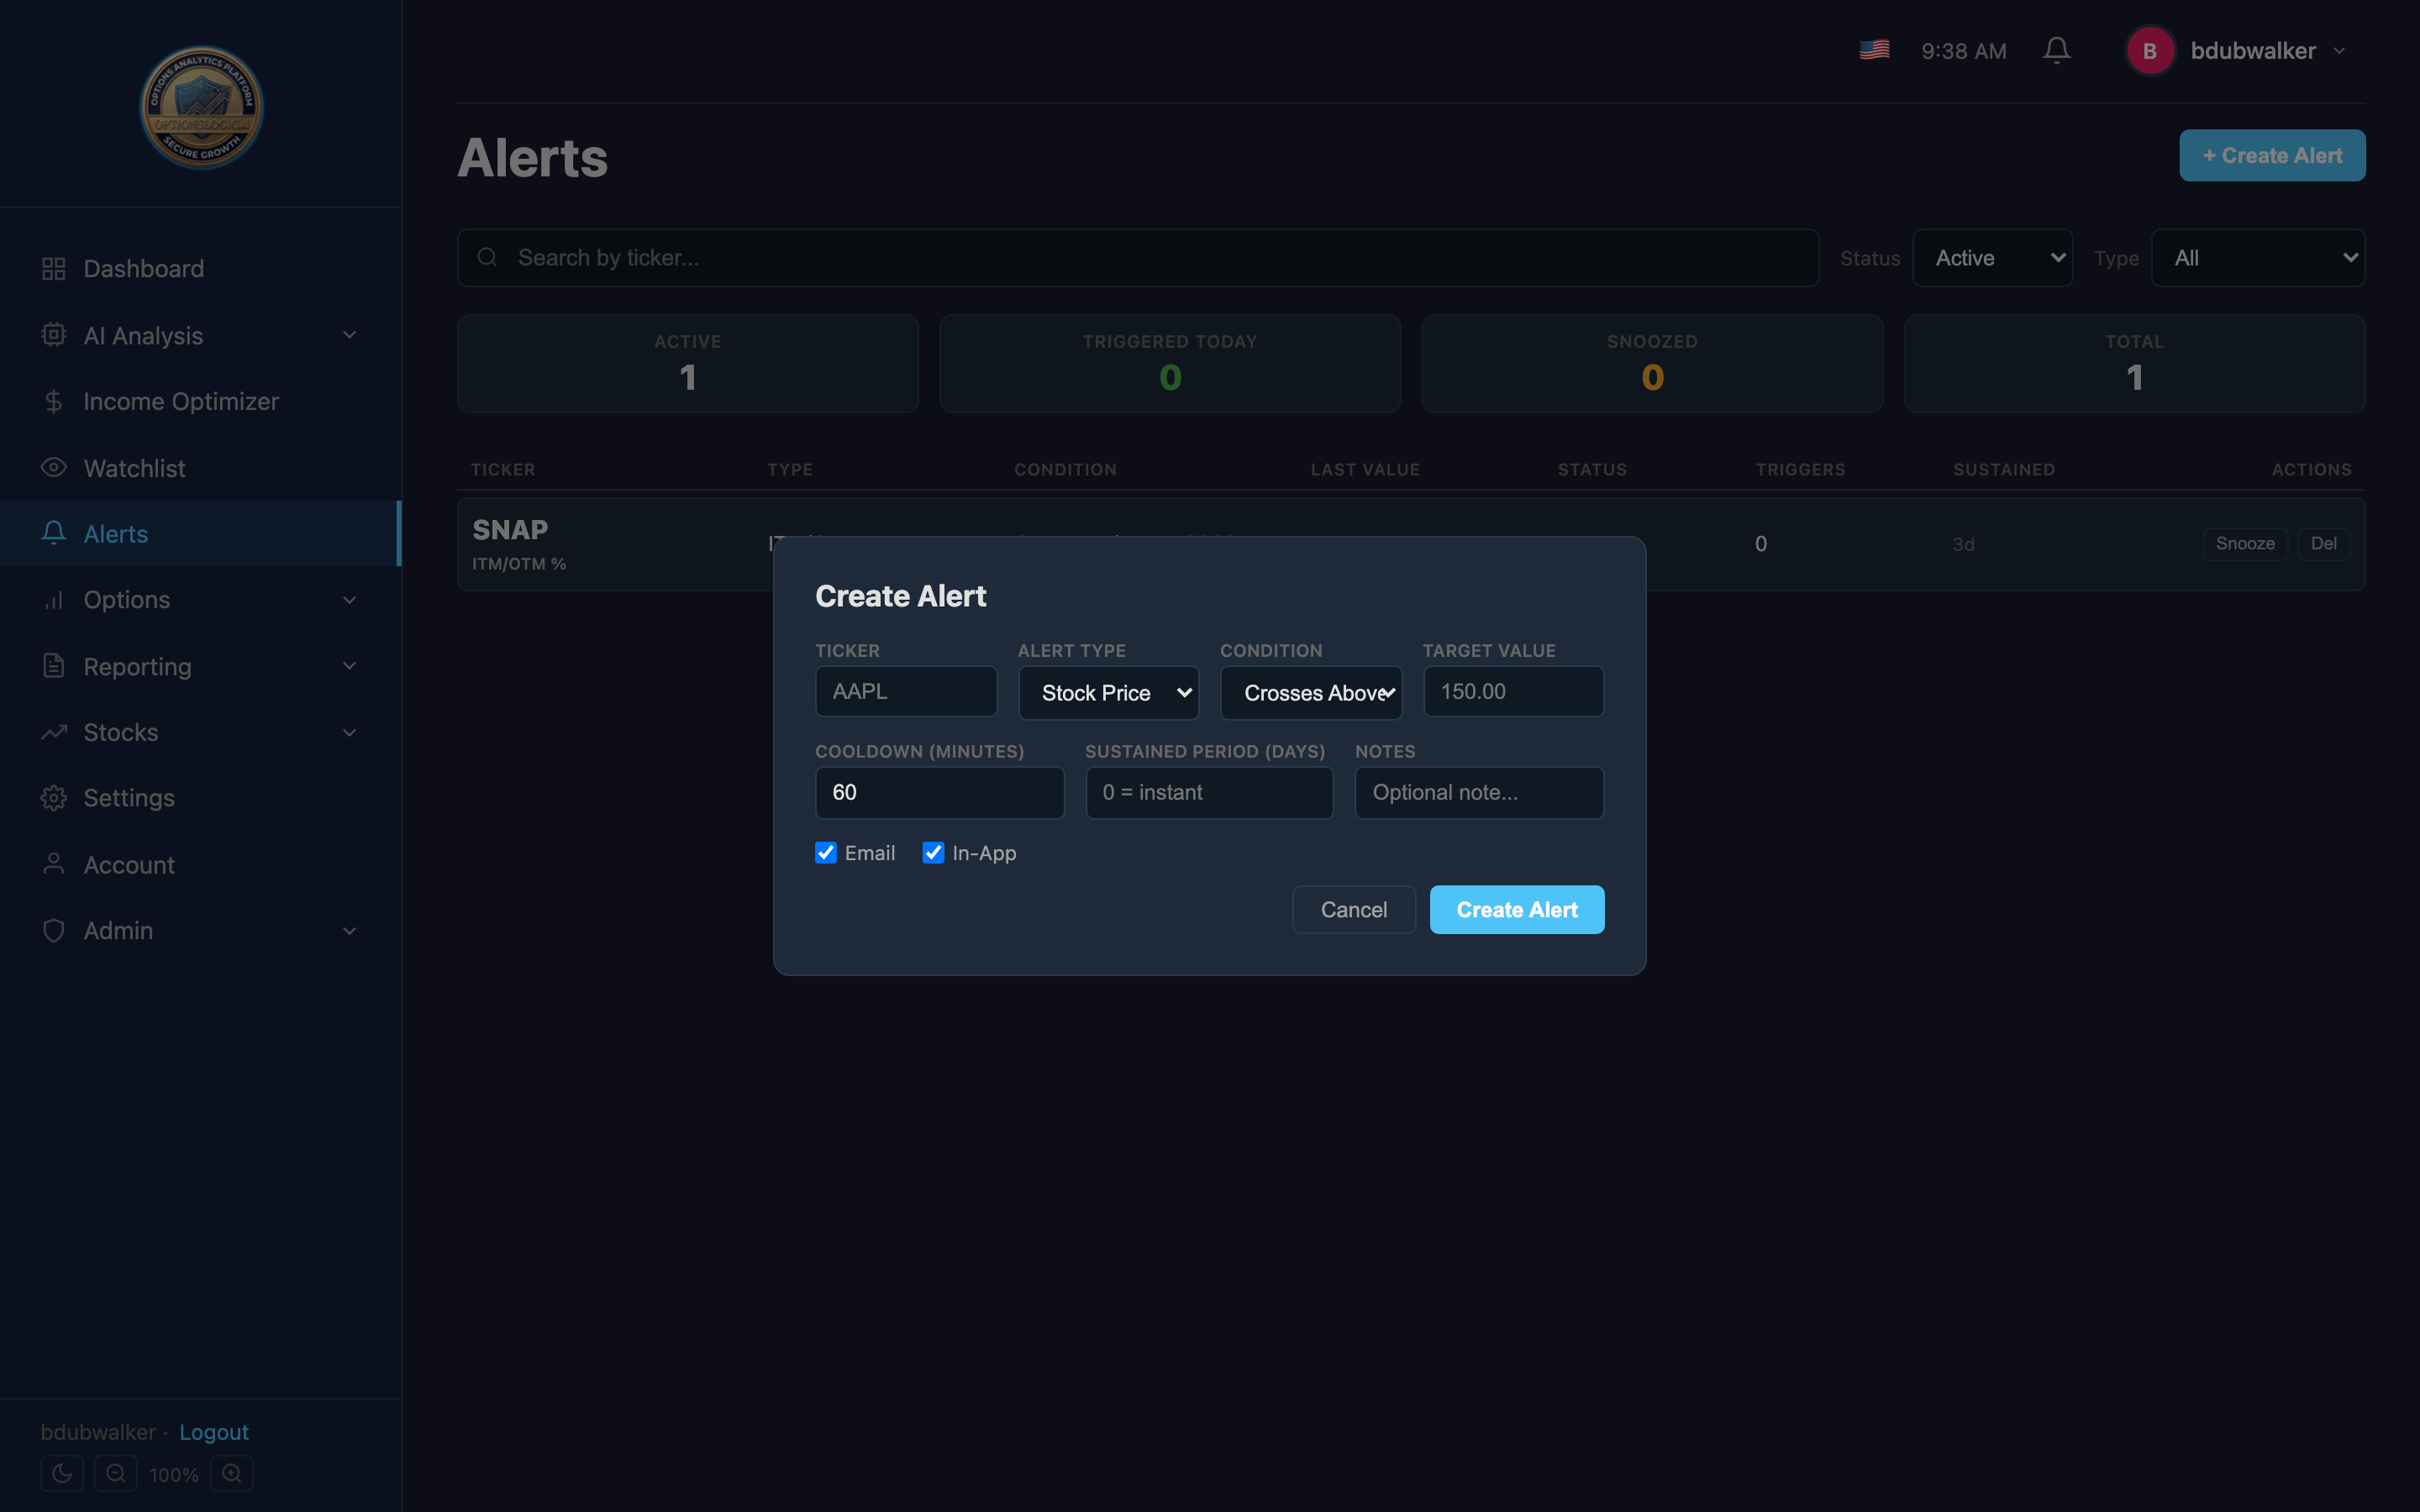
How To: Create an Alert
Alerts notify you via email and in-app notifications when specific conditions are met on your positions or watchlist tickers.
- Navigate to Alerts in the sidebar.
- Click the + Create Alert button in the top-right corner.
- In the modal, enter the Ticker symbol (e.g., AAPL).
- Select an Alert Type from the dropdown:
- Stock Price — triggers on stock price movement
- Option Price — triggers on option premium change
- P/L % Threshold — triggers on profit/loss percentage
- DTE Threshold — triggers when days to expiration reaches a level
- RSI / MACD Signal / Bollinger %B — technical indicator crossovers
- ITM/OTM % — moneyness percentage threshold
- Trade P/L % — per-position profit target
- Set the Condition (Crosses Above, Crosses Below, Above, or Below).
- Enter the Target Value (e.g., 150.00 for a price alert).
- Optionally configure:
- Cooldown (minutes) — how long to snooze after triggering (default: 60)
- Sustained Period (days) — condition must hold for this many days before triggering (0 = instant)
- Notes — any reminder text for yourself
- Check your desired notification channels: Email, In-App, SMS, and/or Discord. SMS and Discord require verification first — see Link Discord for Alerts.
- Click Create Alert.
Managing Alerts
After creation, alerts appear in the table with status badges: Active, Triggered, Snoozed, Expired, or Disabled. Use the row actions to Snooze, Activate, or Delete alerts. Click any row to expand and edit its settings.
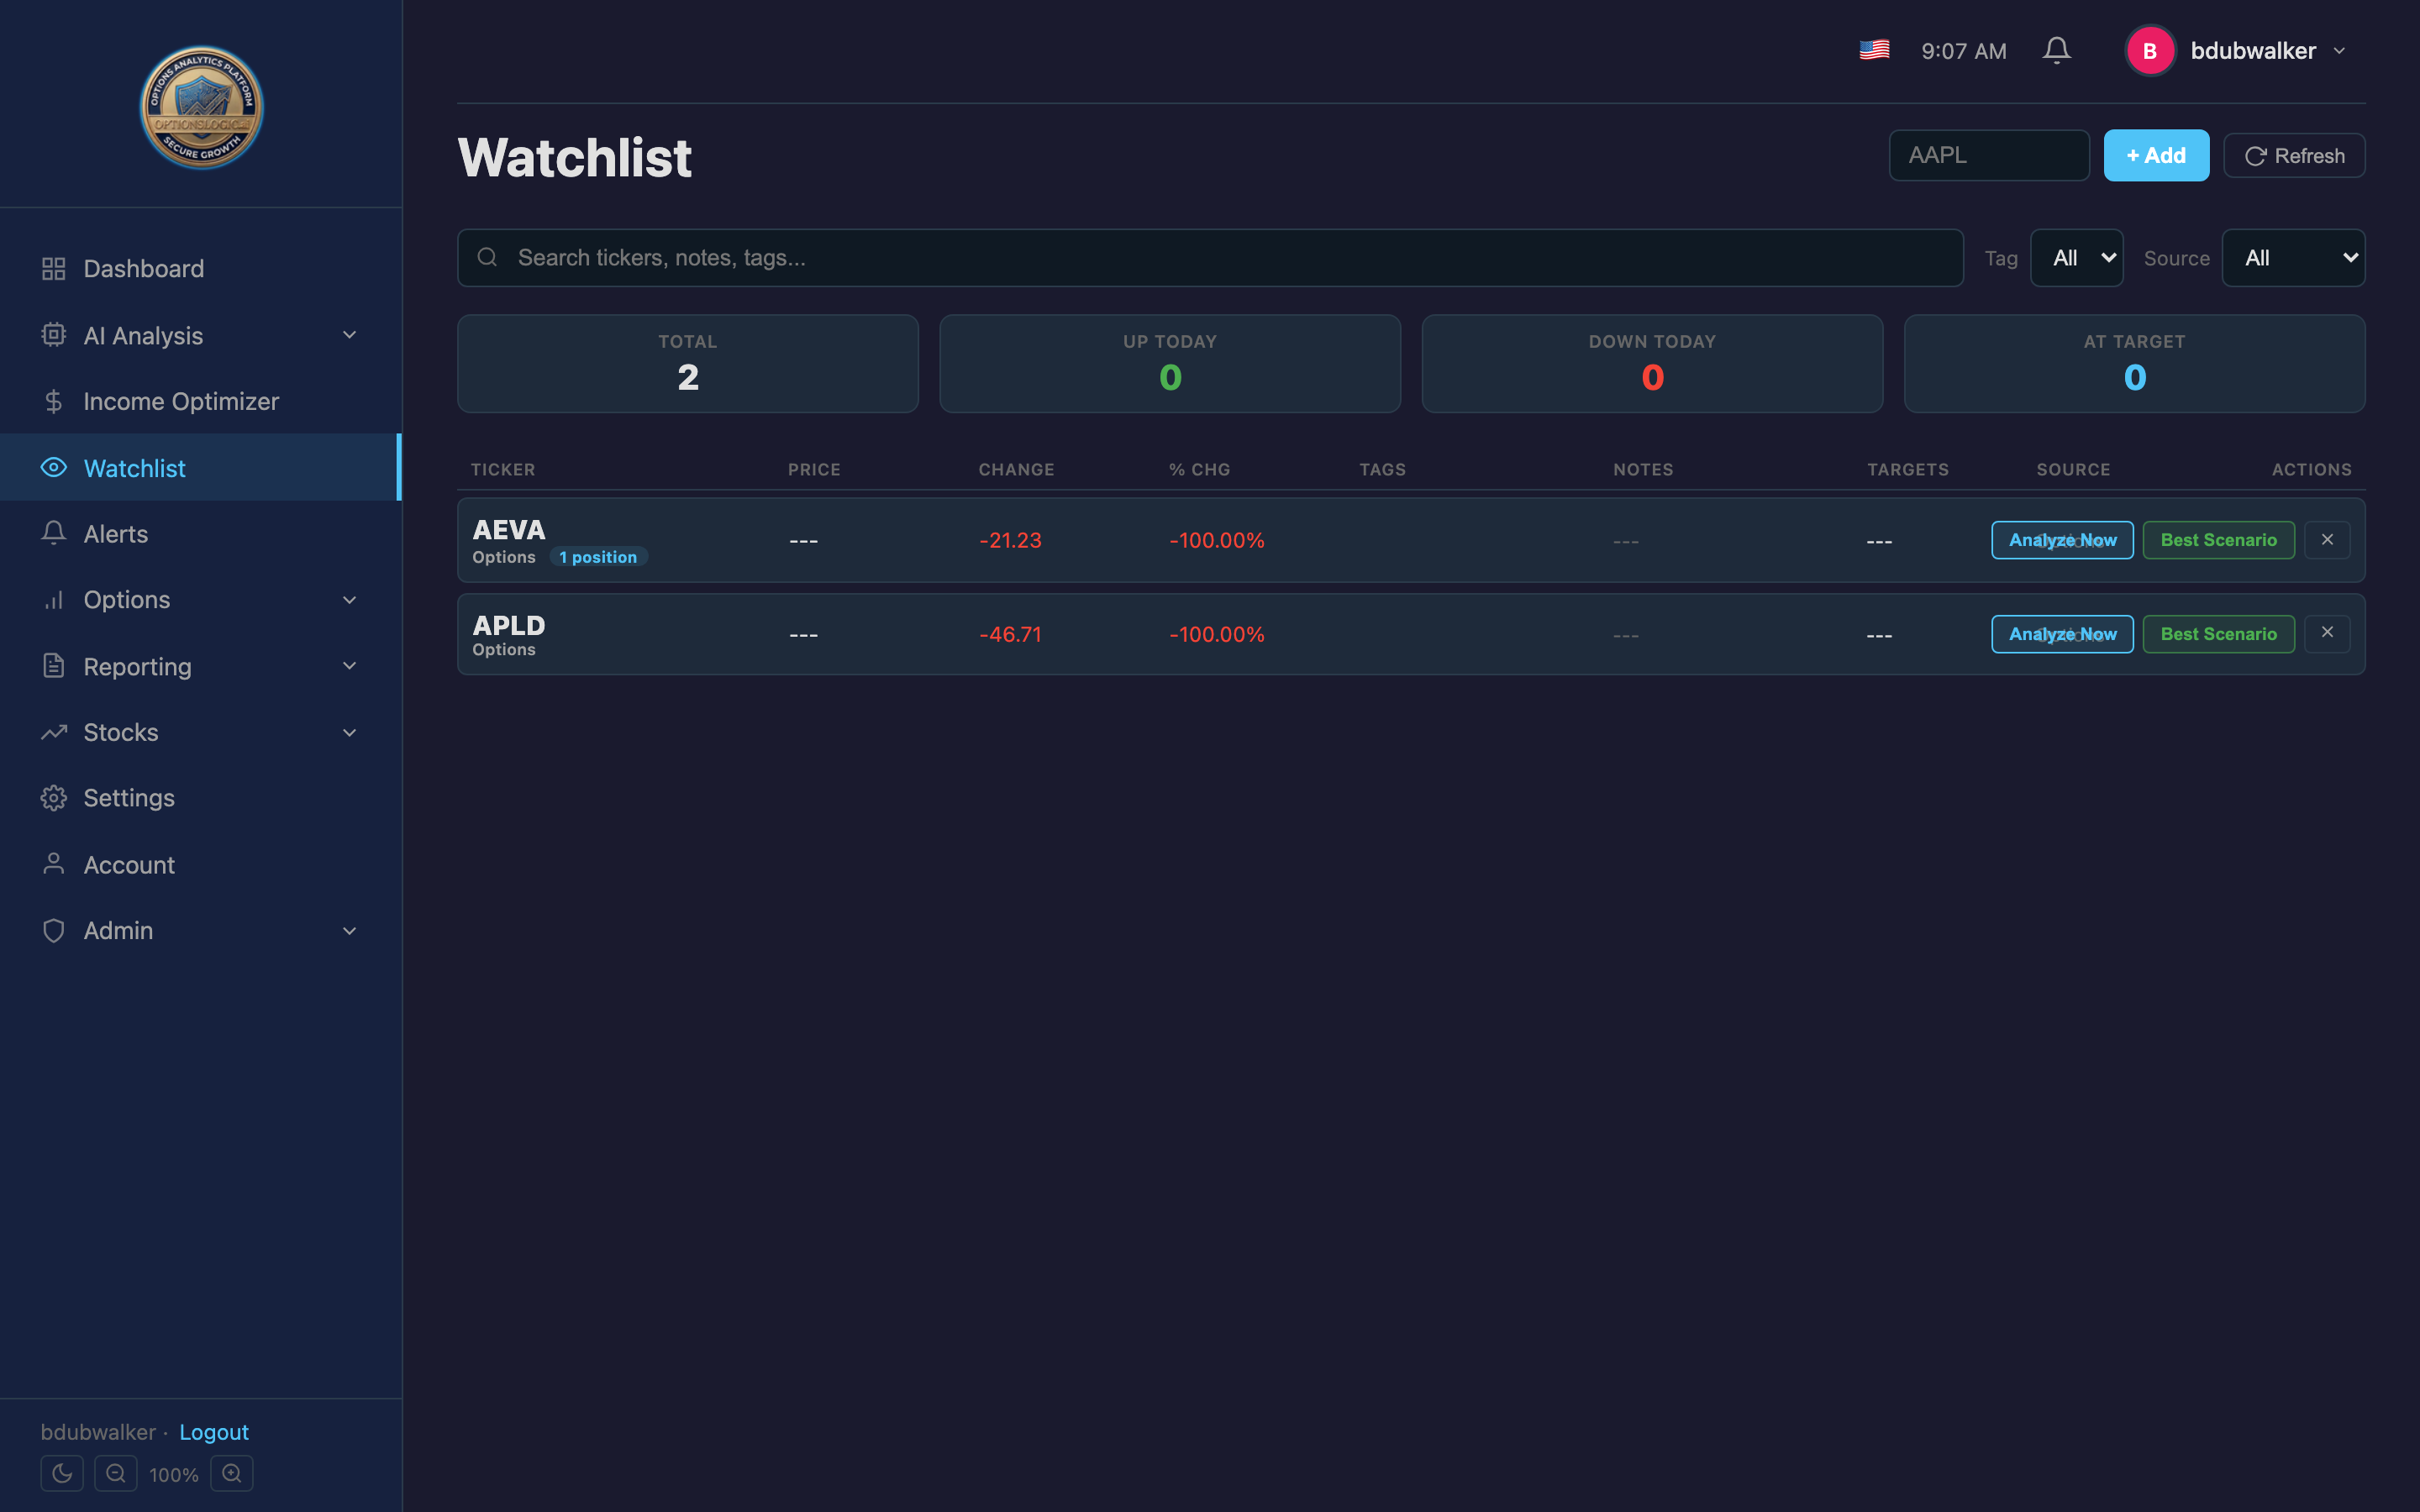
How To: Build a Watchlist
The Watchlist lets you monitor tickers you're interested in, track notes and price targets, and quickly launch analysis tools.
Adding Tickers
- Navigate to Watchlist in the sidebar.
- Type a ticker symbol in the input field at the top (e.g., AAPL).
- Click + Add or press Enter. The ticker appears immediately in the list.
Customizing Watchlist Entries
- Click any ticker row to expand it.
- In the expanded view, you can:
- Add Notes — free text for your trading thesis or reminders
- Add Tags — comma-separated labels for filtering (e.g., "earnings, high-IV")
- Set a Target Stock Price — your price target for the underlying
- Set a Target Option Price — your premium target
- Click Save to store your changes.
Using the Watchlist
- Filter by search text, tag, or source (Manual, Options, Stocks, Signal) using the filter bar.
- Summary cards at the top show total count, tickers up today, down today, and at target.
- If a ticker has open options positions, expanding the row shows a live positions table with strategy, DTE, P&L, and % of max profit.
- If a ticker was scanned in Signal Confluence, the expanded view shows the score, recommendation, and suggested trades by DTE period.
- Use the row action buttons: Analyze Now (launches Signal Confluence), Best Scenario, or Remove.

How To: Run a Signal Confluence Scan
Signal Confluence scans a universe of tickers and scores every trade opportunity across 10 weighted technical indicators.
Full Universe Scan
- Navigate to AI Analysis > Signal Confluence in the sidebar.
- Select a Universe from the dropdown: AI Tickers, Nasdaq 100, S&P 500, or All.
- Set Min Conviction (default 50%) — only show results above this score.
- Set Min Agree (default 3+ sources) — minimum number of indicators that must agree.
- Choose Direction (Buy + Sell, Buy only, or Sell only).
- Choose Type (Put + Call, Put only, Call only, or Spreads only).
- Optionally set a Price Range (min/max stock price) and DTE filter.
- Click Scan Universe. The scan runs across all tickers in the selected universe.
Quick Ticker Analysis
- In the Tickers field below the scan controls, enter one or more symbols separated by commas (e.g., AAPL, MSFT, NVDA).
- Click Analyze. Results load for just those tickers with full charts and indicator breakdowns.
Reading Results
Each result card shows the conviction score (color-coded green/yellow/red), the recommendation, and suggested trades grouped by DTE period (Weekly, Monthly, Quarterly, Semi-Annual, LEAPS). Each suggested trade shows strategy, strike, DTE, delta, %OTM, and score.

How To: Take a Trade from an AI Recommendation
When Signal Confluence suggests a trade, you can send it directly to Trade Actions with all fields pre-filled.
- Run a Signal Confluence scan or analysis (see above).
- Find a suggested trade in the results — each DTE period tab shows recommended trades with strategy, strike, and score.
- Click the Open Trade button on the trade row.
- You'll be redirected to Trade Actions. The Create Position modal opens automatically with pre-filled fields: ticker, strategy, strike, expiration, and AI metadata (confluence level, source).
- Add your Account, Contracts, Premium, and Commission.
- Click Create Position to open the trade in your portfolio.
Alternative: Save for Later
If you're not ready to take the trade yet, click the star icon on any result card to save it to your Watchlist with the full signal data attached. You can review it later and take the trade from the Watchlist expanded view.
Back to topHow To: Enable Automatic Downloads
Automatic downloads keep your portfolio data up to date without manual intervention. The system downloads and analyzes your Fidelity data twice daily on weekdays.
- First, make sure your Credential Vault is set up (see Set Up Credential Vault).
- Navigate to Settings in the sidebar.
- In the Credential Vault section, find the Automatic Downloads checkbox.
- Check the box to enable. The status text will read: "Scheduled downloads run twice daily on weekdays."
- Uncheck to pause automatic downloads. You can still trigger manual downloads at any time using the Download Fidelity CSVs button.
How To: Link Discord for Alert Notifications
Link your Discord account to receive alert notifications as private DMs from the OptionsLogic.AI PRISM bot. Each user gets their own private alerts — nothing is posted to public channels.
Step 1: Enable Developer Mode in Discord
You need Developer Mode to copy your Discord User ID (a numeric identifier, not your username).
- Open Discord (desktop or browser).
- Click the gear icon (User Settings) next to your username at the bottom-left.
- Scroll down in the left sidebar to Advanced (under App Settings).
- Toggle Developer Mode on.
Step 2: Copy Your Discord User ID
- Go to any server where you are a member (e.g., the OptionsLogic.AI PRISM server).
- Find your name in the member list on the right side.
- Right-click your username — do not left-click (that opens your profile popup).
- Click Copy User ID at the bottom of the context menu.
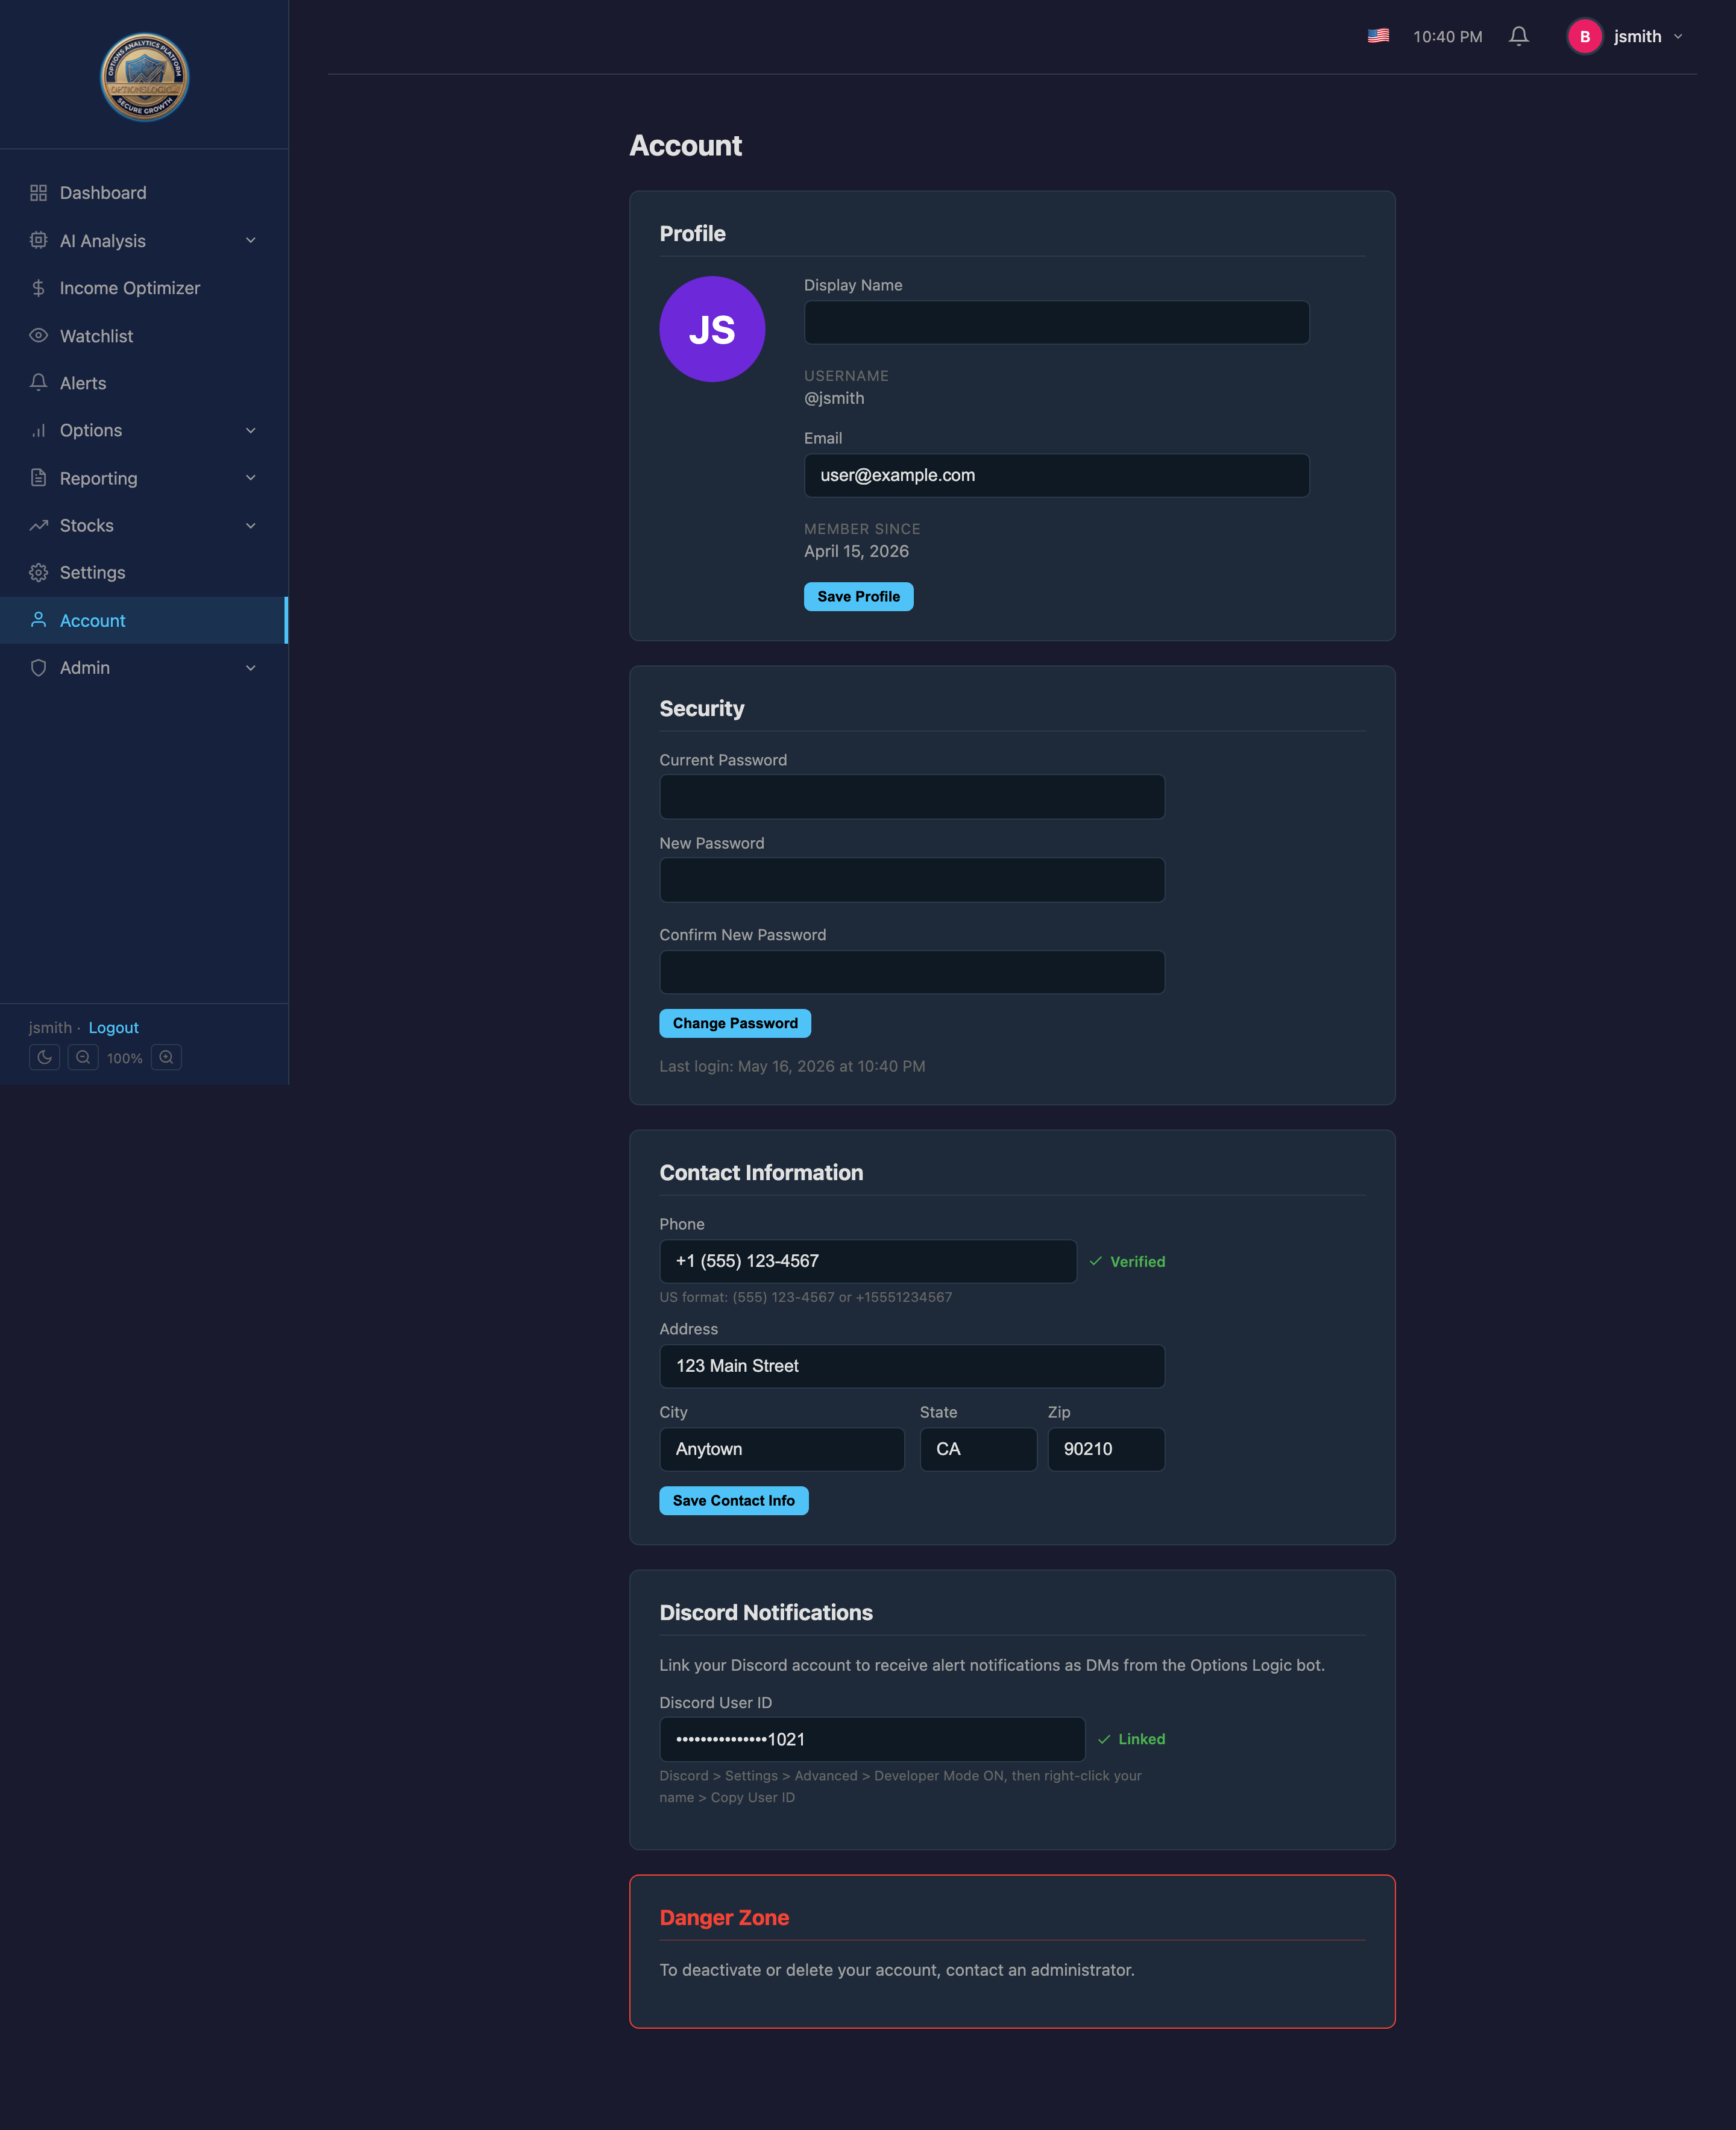
1220733703219581021 — it is not your username or display name.Step 3: Link and Verify on the Account Page
- In OptionsLogic.AI PRISM, navigate to Account in the sidebar.
- Scroll down to the Discord Notifications section.
- Paste your Discord User ID into the input field.
- Click Link Discord. The bot will send a 6-digit verification code to your Discord DMs.
- Check your Discord DMs — you will have a message from the OptionsLogic.AI PRISM bot with the code.
- Enter the 6-digit code in the verification modal and click Verify.
- A green Linked badge will appear next to your Discord User ID.
Step 4: Enable Discord on Your Alerts
- When creating or editing an alert, check the Discord checkbox under notification channels.
- When the alert triggers, you will receive a rich embed DM with the ticker, alert type, condition, target value, and current value.
- TD Sequential alerts also show whether it is a Buy Reversal or Sell Reversal signal.